Manage Panels
This section shows how you can create, update, and remove a panel.
Prerequisites
- This section assumes that your application is already instrumented. For details about how you can instrument your application, see the Instrument Your Application section.
- This section assumes that you are familiar with the basics of monitoring applications.
Add a Panel to a Dashboard
SigNoz supports two types of panels: time series, which displays a metric over a time interval, and value, which displays only the most recent value. To add a panel to a dashboard, follow the steps below:
- From the sidebar, choose Dashboards.
- Find the dashboard to which you want to add a new panel.
- Select Add Panel.
- Select either Time Series or Value.
- Populate the following fields:
- Panel Title: Enter a descriptive name for your panel.
- Description: Enter a brief and meaningful description of your new panel.
- (Optional) Panel Time Preference: You can use the the drop-down list to specify the time range for which you want to view data. The time range you specify here overrides the global value.
- (Optional) Y Axis Unit: Specify the unit of measurement for the y-axis.
- To specify the data displayed on your panel, you can use:
- The query builder. The query builder provides an easy-to-use graphical interface that allows you create custom queries. For instructions, see the Create a Custom Query page.
- The declarative query language based on SQL that ClickHouse supports. For details, see the SQL Reference page of the ClickHouse documentation.
- PromQL. For details see the Prometheus Querying Language page of the Prometheus documentation.
- (Optional) If you’re using the query builder, you can also transform your data by adding mathematical functions. For example, you can divide the value that a query returns by a number. The following mathematical functions are supported: exp, log, ln, exp2, log2, exp10, log10, sqrt, cbrt, erf, erfc, lgamma, tgamma, sin, cos, tan, asin, acos, atan, degrees, radians.
- (Optional) You can plot up to ten queries on the same panel. To plot a new query, select the + Query button.
- When you’ve finished, select the Save button.
Note the following about panels:
- The total number of queries and functions you can plot on a single panel must be less or equal to ten.
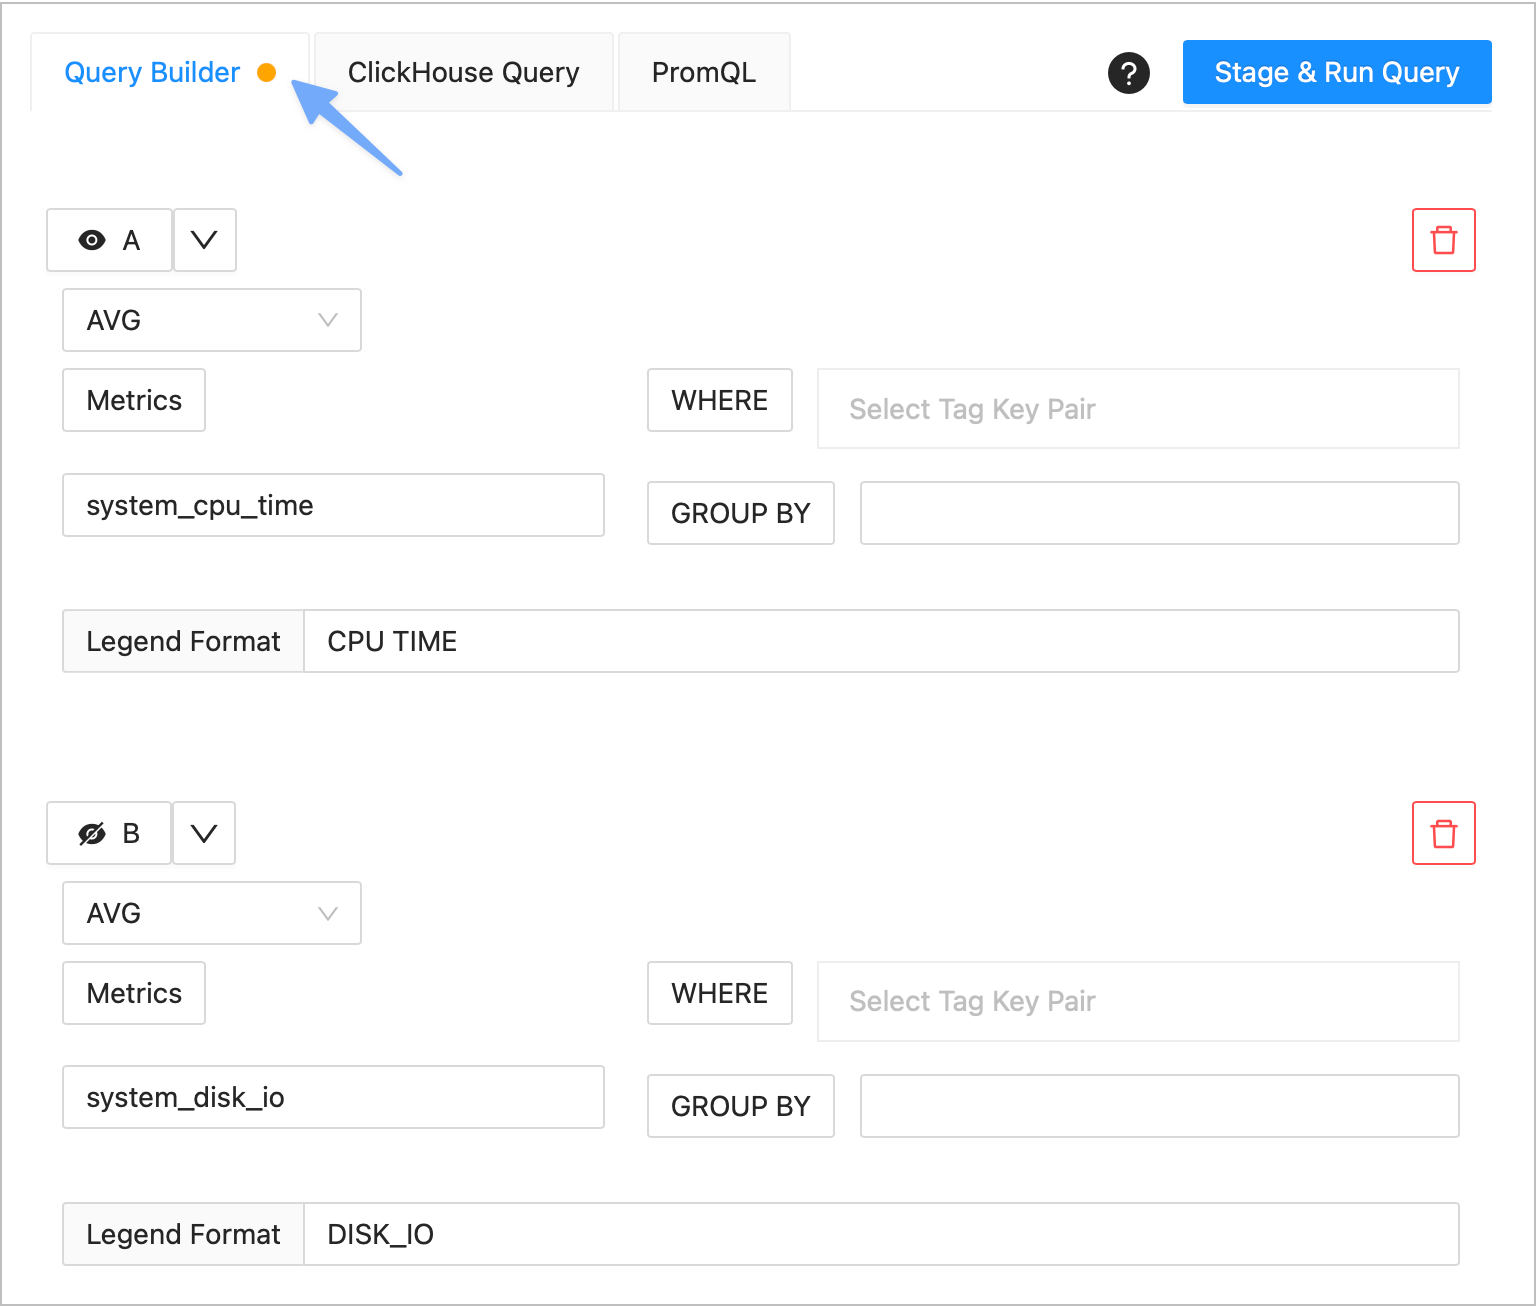
- Every time you add or modify a function or formula, you must select the Stage & Run Query button. If you do not select this button, the panel will not be updated and your changes will be lost whenever you move to a different tab. When you have unsaved changes, the system will display an orange circle next to the name of the tab that you've modified:

- You can hide or unhide a function or formula by selecting the eye icon at its left and then selecting the Stage & Run Query button.
- When you install SigNoz, only the data provided by the Hostmetric receiver is available. To enable more metric receivers, see the Send Metrics to SigNoz section.
Update a Panel
- From the sidebar, choose Dashboard.
- Find the dashboard in which you created the panel you wish to update, and then select the pencil icon located at the top right corner of your panel.
- Make the changes.
- When you’ve finished, select the Save button.
Get Help
If you need help with the steps in this topic, please reach out to us on Slack.