Errors and Exceptions
Recording exceptions
Languages that support auto instrumentations(Python, Java, Ruby, Javascript) automatically record exceptions. For other languages, we need to record exceptions manually. Also, in some cases even for an auto-instrumented app, you may want to record custom exceptions manually.
To manually record exceptions, we need to get the span from the tracer and then call a function called recordException() or recordError() which varies across languages. Also, you can set the status of the span to error if the exception means the operation results in an error state.
Below are examples of how to record exceptions in different languages.
Java
// Get the current span from the tracer
Span span = Span.current();

// recordException converts a Throwable into a span event.
span.recordException(new RuntimeException("Something went wrong"));

// Set the status of the span to error
span.setStatus(StatusCode.ERROR, "Something bad happened!");
Golang
import "go.opentelemetry.io/otel/codes"

// Get the current span from the tracer
span := trace.SpanFromContext(ctx)

// RecordError converts an error into a span event.
span.RecordError(err)

// Mark span as failed.
span.SetStatus(codes.Error, "internal error")
Python
# Get the current span from the tracer
from opentelemetry import trace
from opentelemetry.trace.status import Status, StatusCode

span = trace.get_current_span()

# record_exception converts the exception into a span event.
exception = Exception("Something went wrong")
span.record_exception(exception)

# Update the span status to failed.
span.set_status(Status(StatusCode.ERROR, "internal error"))
JavaScript
// Get the current span from the tracer
const span = api.getSpan(api.context.active());

// recordException converts the error into a span event.
span.recordException(err);

// Update the span status to failed.
span.setStatus({ code: api.SpanStatusCode.ERROR, message: String(err)});
.NET
OpenTelemetry .NET provides several options to report Exceptions in Activity. It varies from the most basic option of setting Status, to fully recording the Exception itself to activity. Follow opentelemetry .NET documentation to learn more.
Below is one such example:
using (var activity = MyActivitySource.StartActivity("Foo"))
{
    try
    {
        Func();
    }
    catch (SomeException ex)
    {
        activity?.SetStatus(ActivityStatusCode.Error, ex.message);
        activity?.RecordException(ex);
    }
}
Ruby
# Get the current span from the tracer
span = OpenTelemetry::Trace.current_span

rescue Exception => e
  # Record the exception and update the span status.
  span.record_exception(e)
  span.status = OpenTelemetry::Trace::Status.error(e.to_s)
end
PHP
//start a root span
$rootSpan = $tracer->spanBuilder('root')->startSpan();
//future spans will be parented to the currently active span
$rootScope = $rootSpan->activate();

try {
    $span1 = $tracer->spanBuilder('foo')->startSpan();
    $span1Scope = $span1->activate();

    try {
        $span2 = $tracer->spanBuilder('bar')->startSpan();
        echo 'OpenTelemetry welcomes PHP' . PHP_EOL;
        $span2->end();
    } finally {
        $span1Scope->detach();
        $span1->end();
    }
} catch (Throwable $t) {
    //The library's code shouldn't be throwing unhandled exceptions (it should emit any errors via diagnostic events)
    //This is intended to illustrate a way you can capture unhandled exceptions coming from your app code
    $rootSpan->recordException($t);
} finally {
    //ensure span ends and scope is detached
    $rootScope->detach();
    $rootSpan->end();
}
Viewing Exceptions
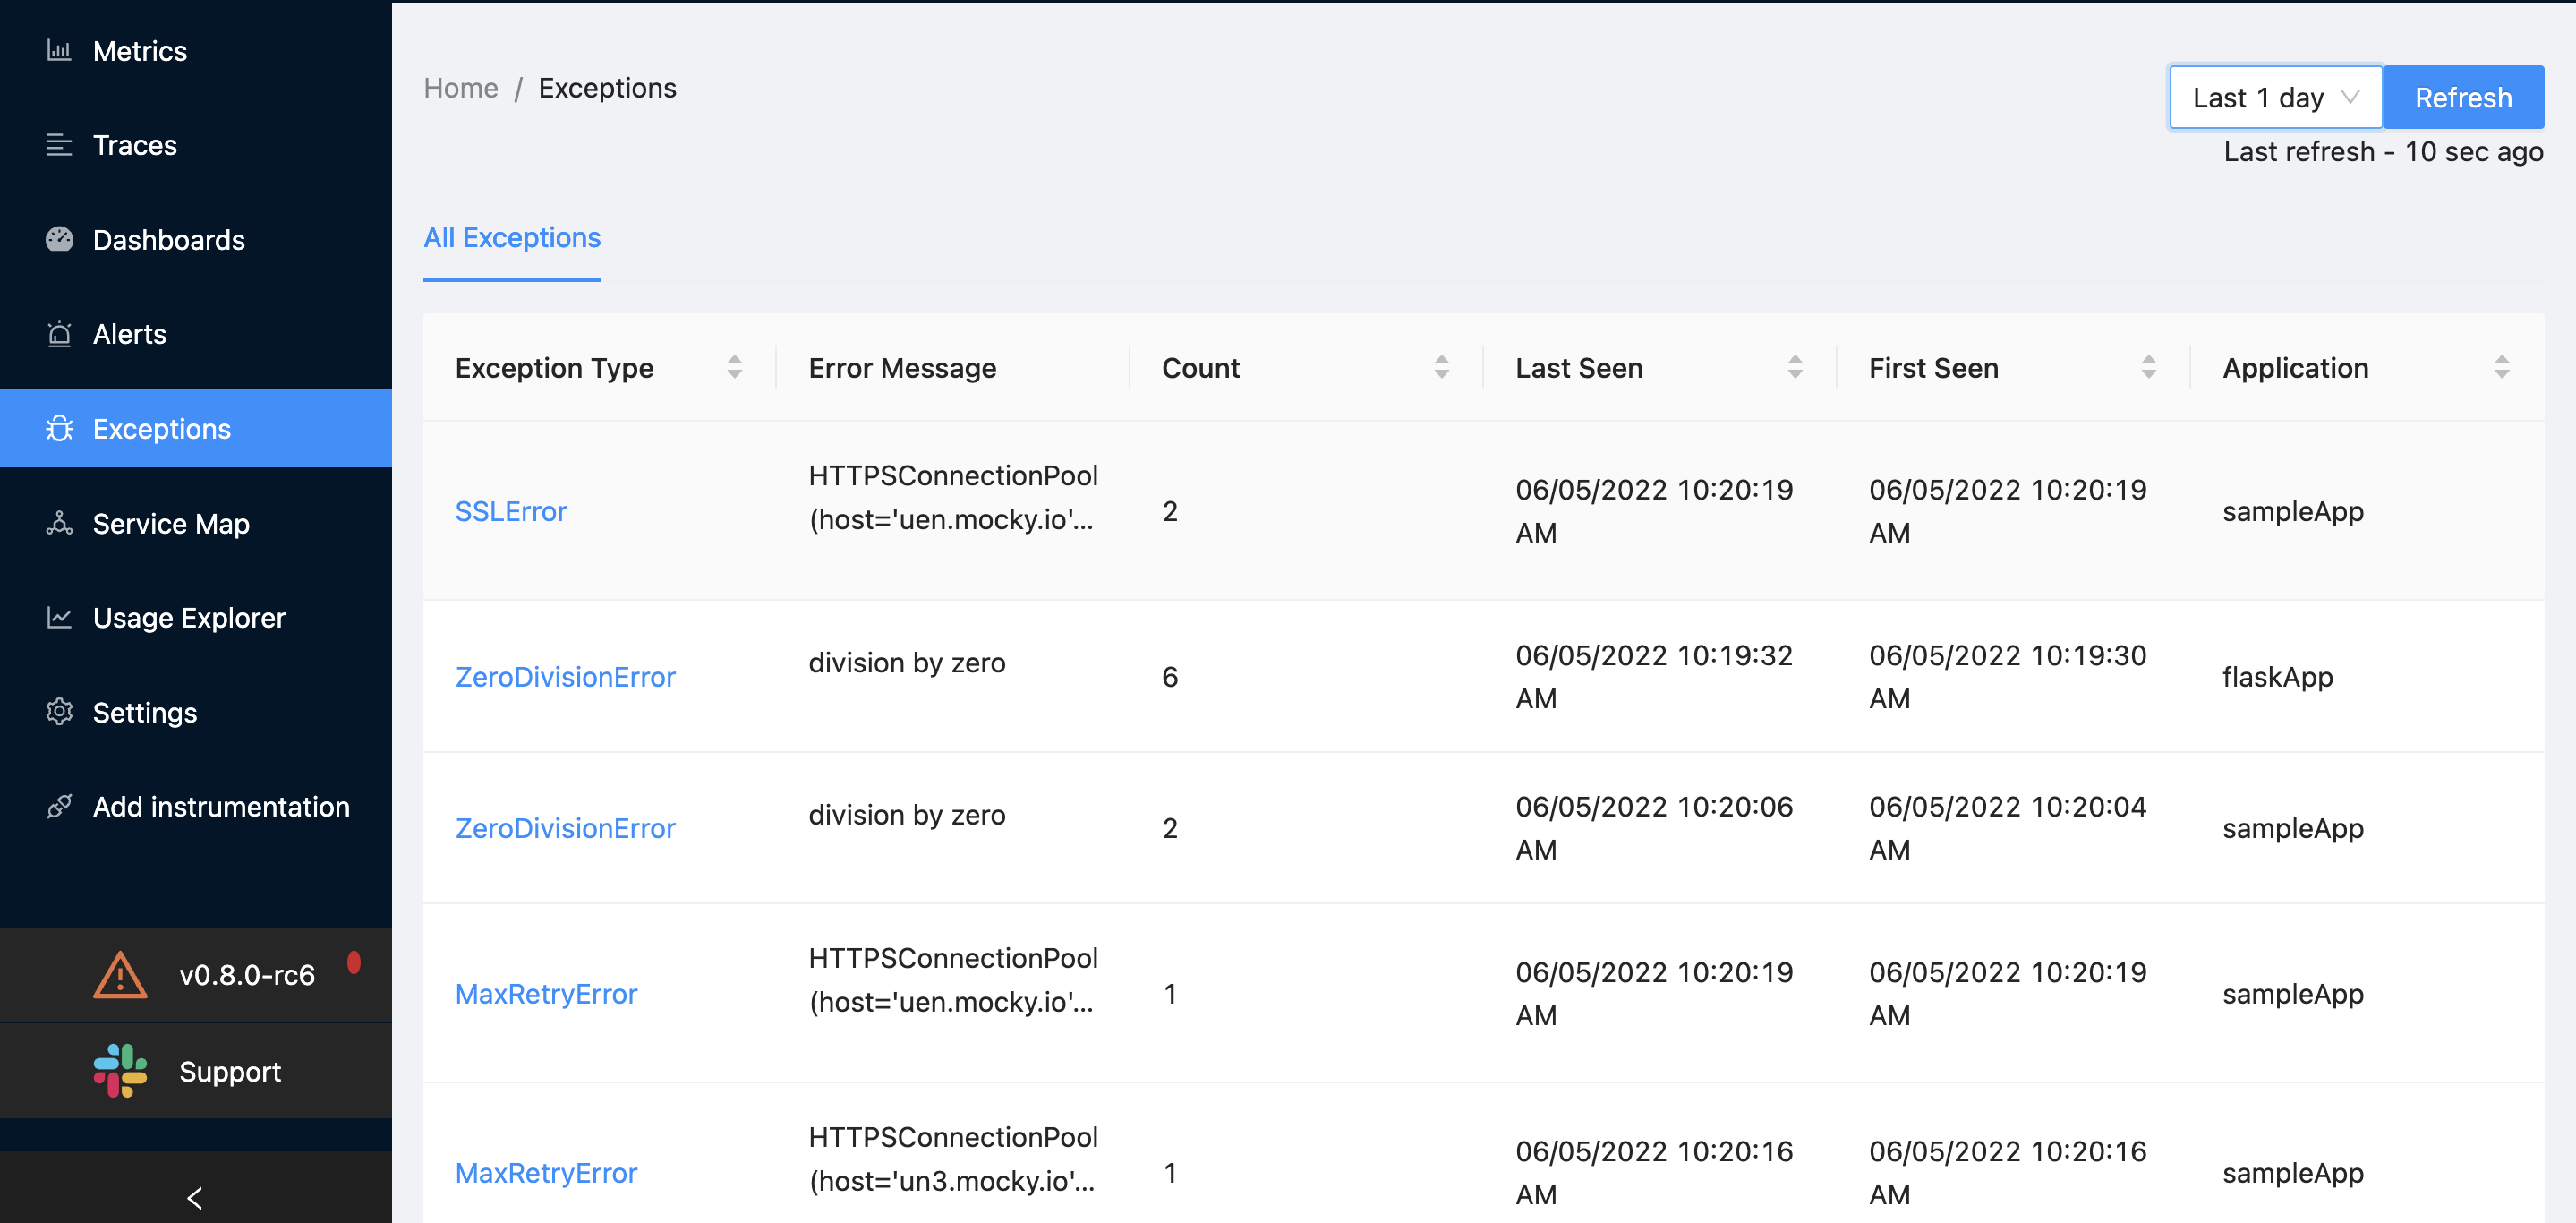
The Exceptions tab shows list of exceptions which applications encounter.
It shows the list of exceptions in the applications in a separate page so that users can access them easily. It is also linked to trace pages through which you can see where in a trace is a request facing an exception
You can sort exceptions by Last Seen, First Seen, Count, Exception type and Application name

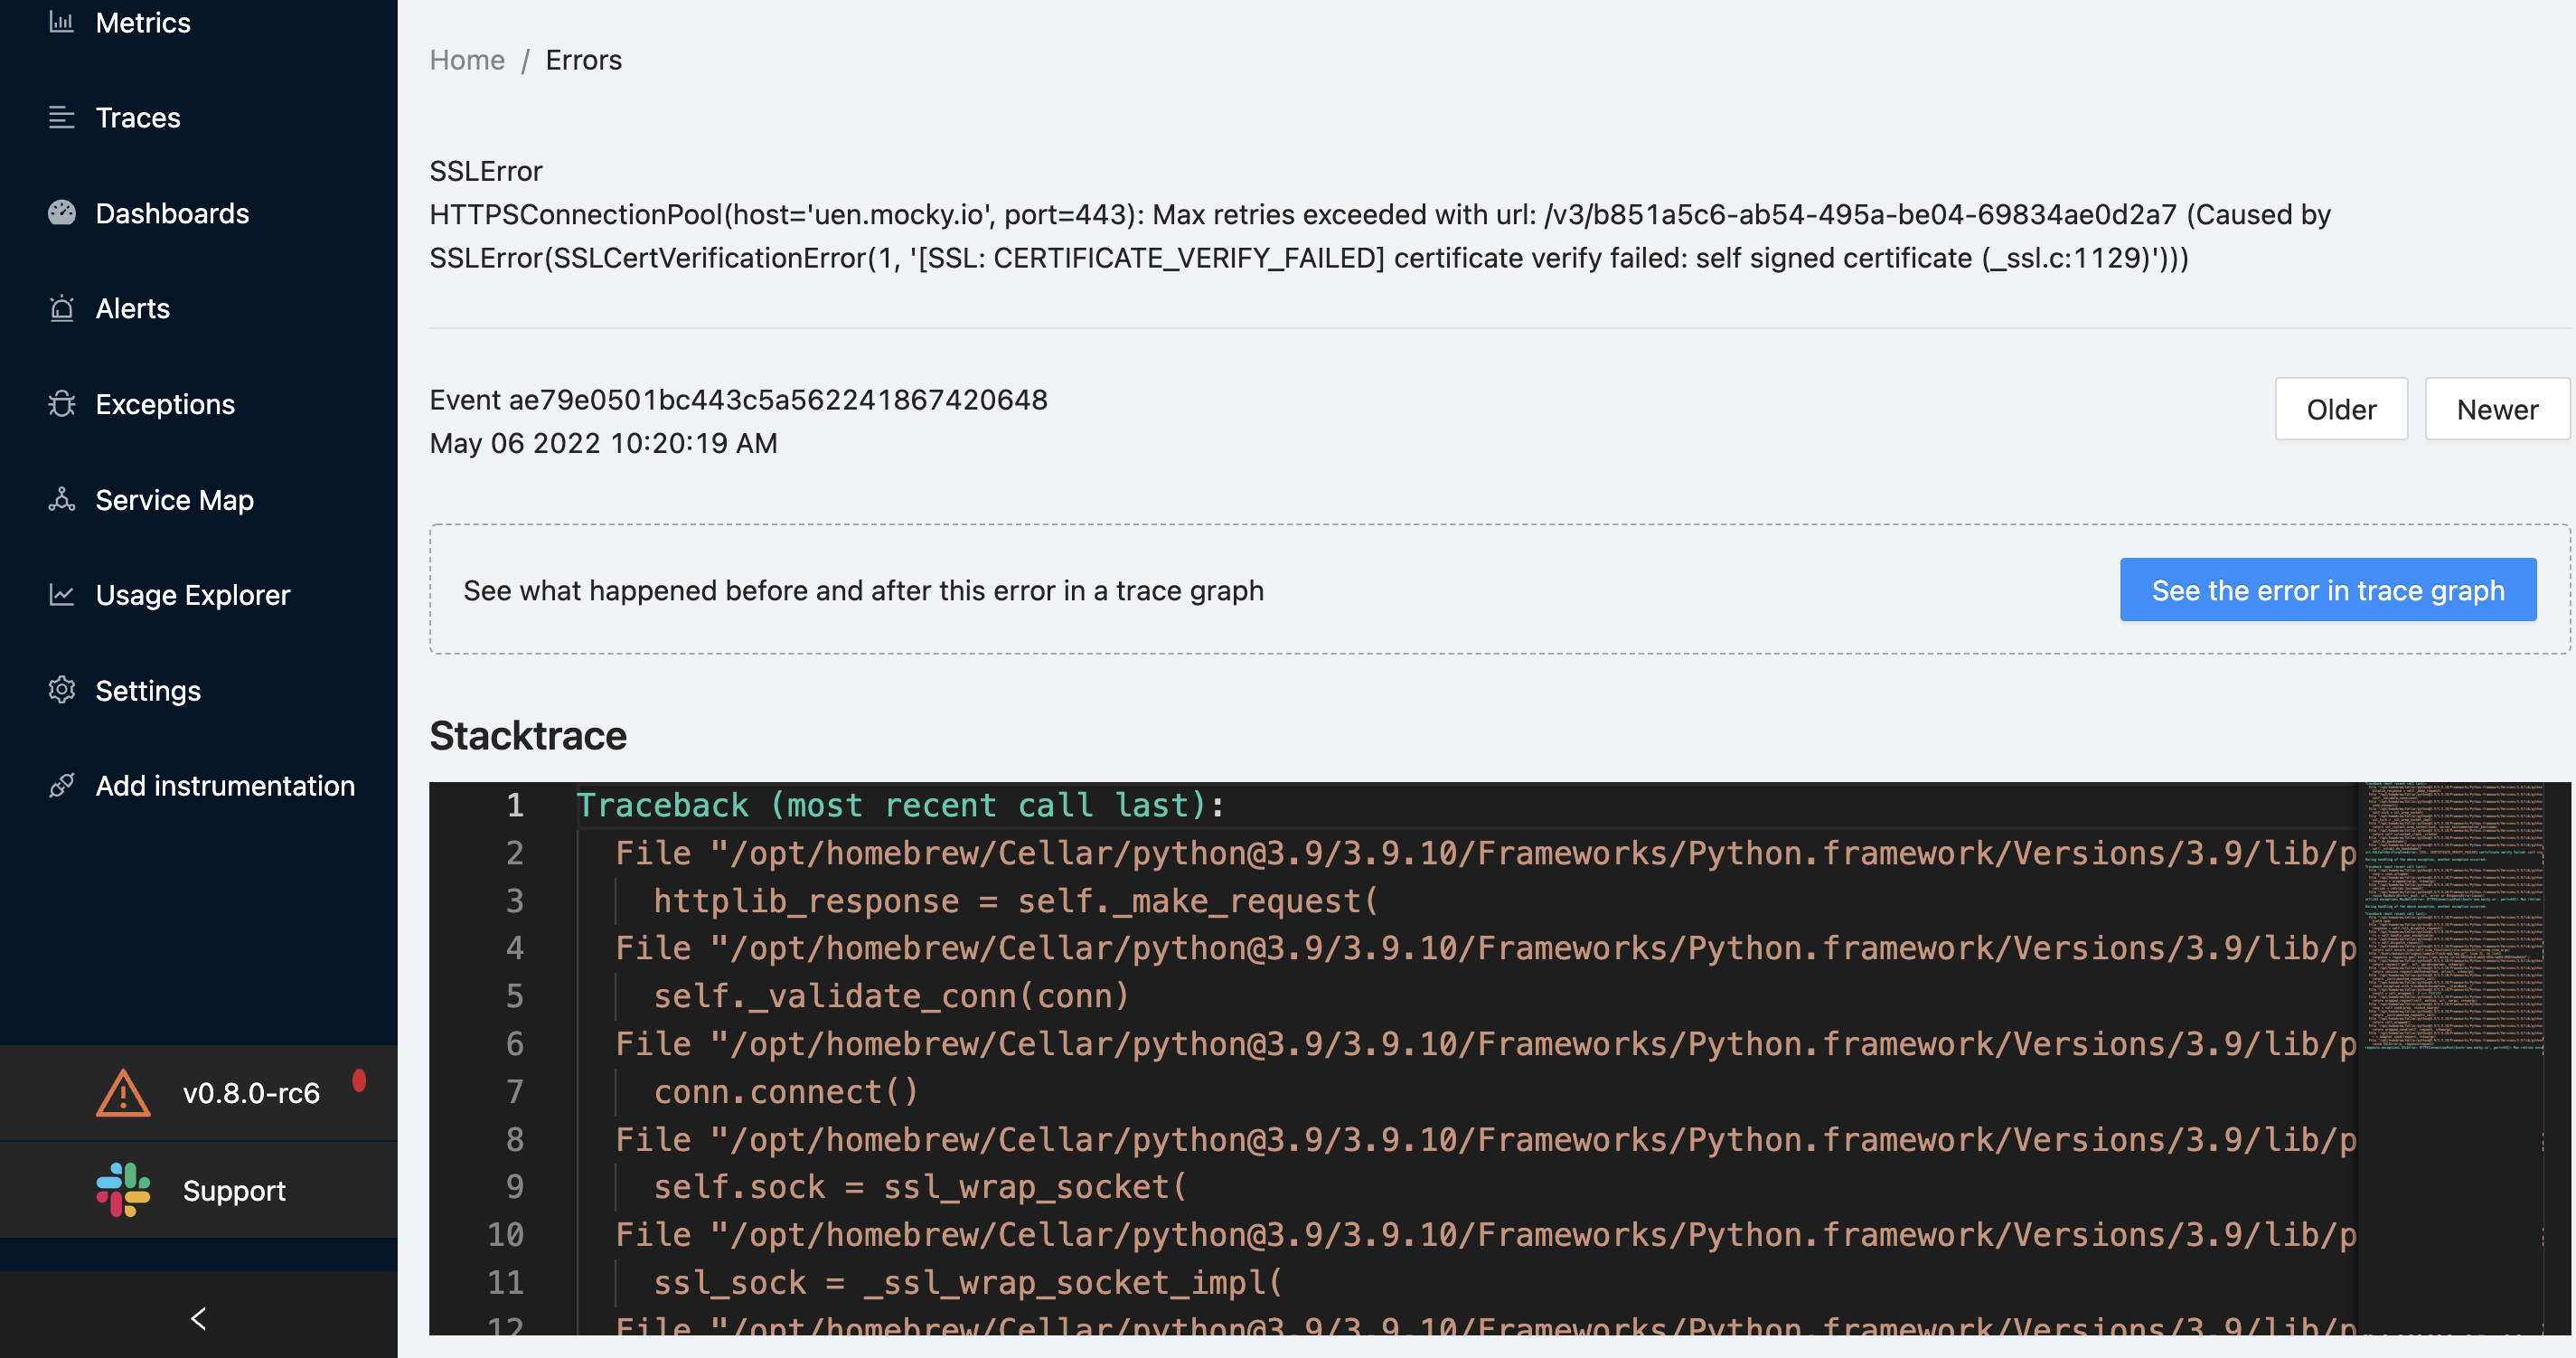
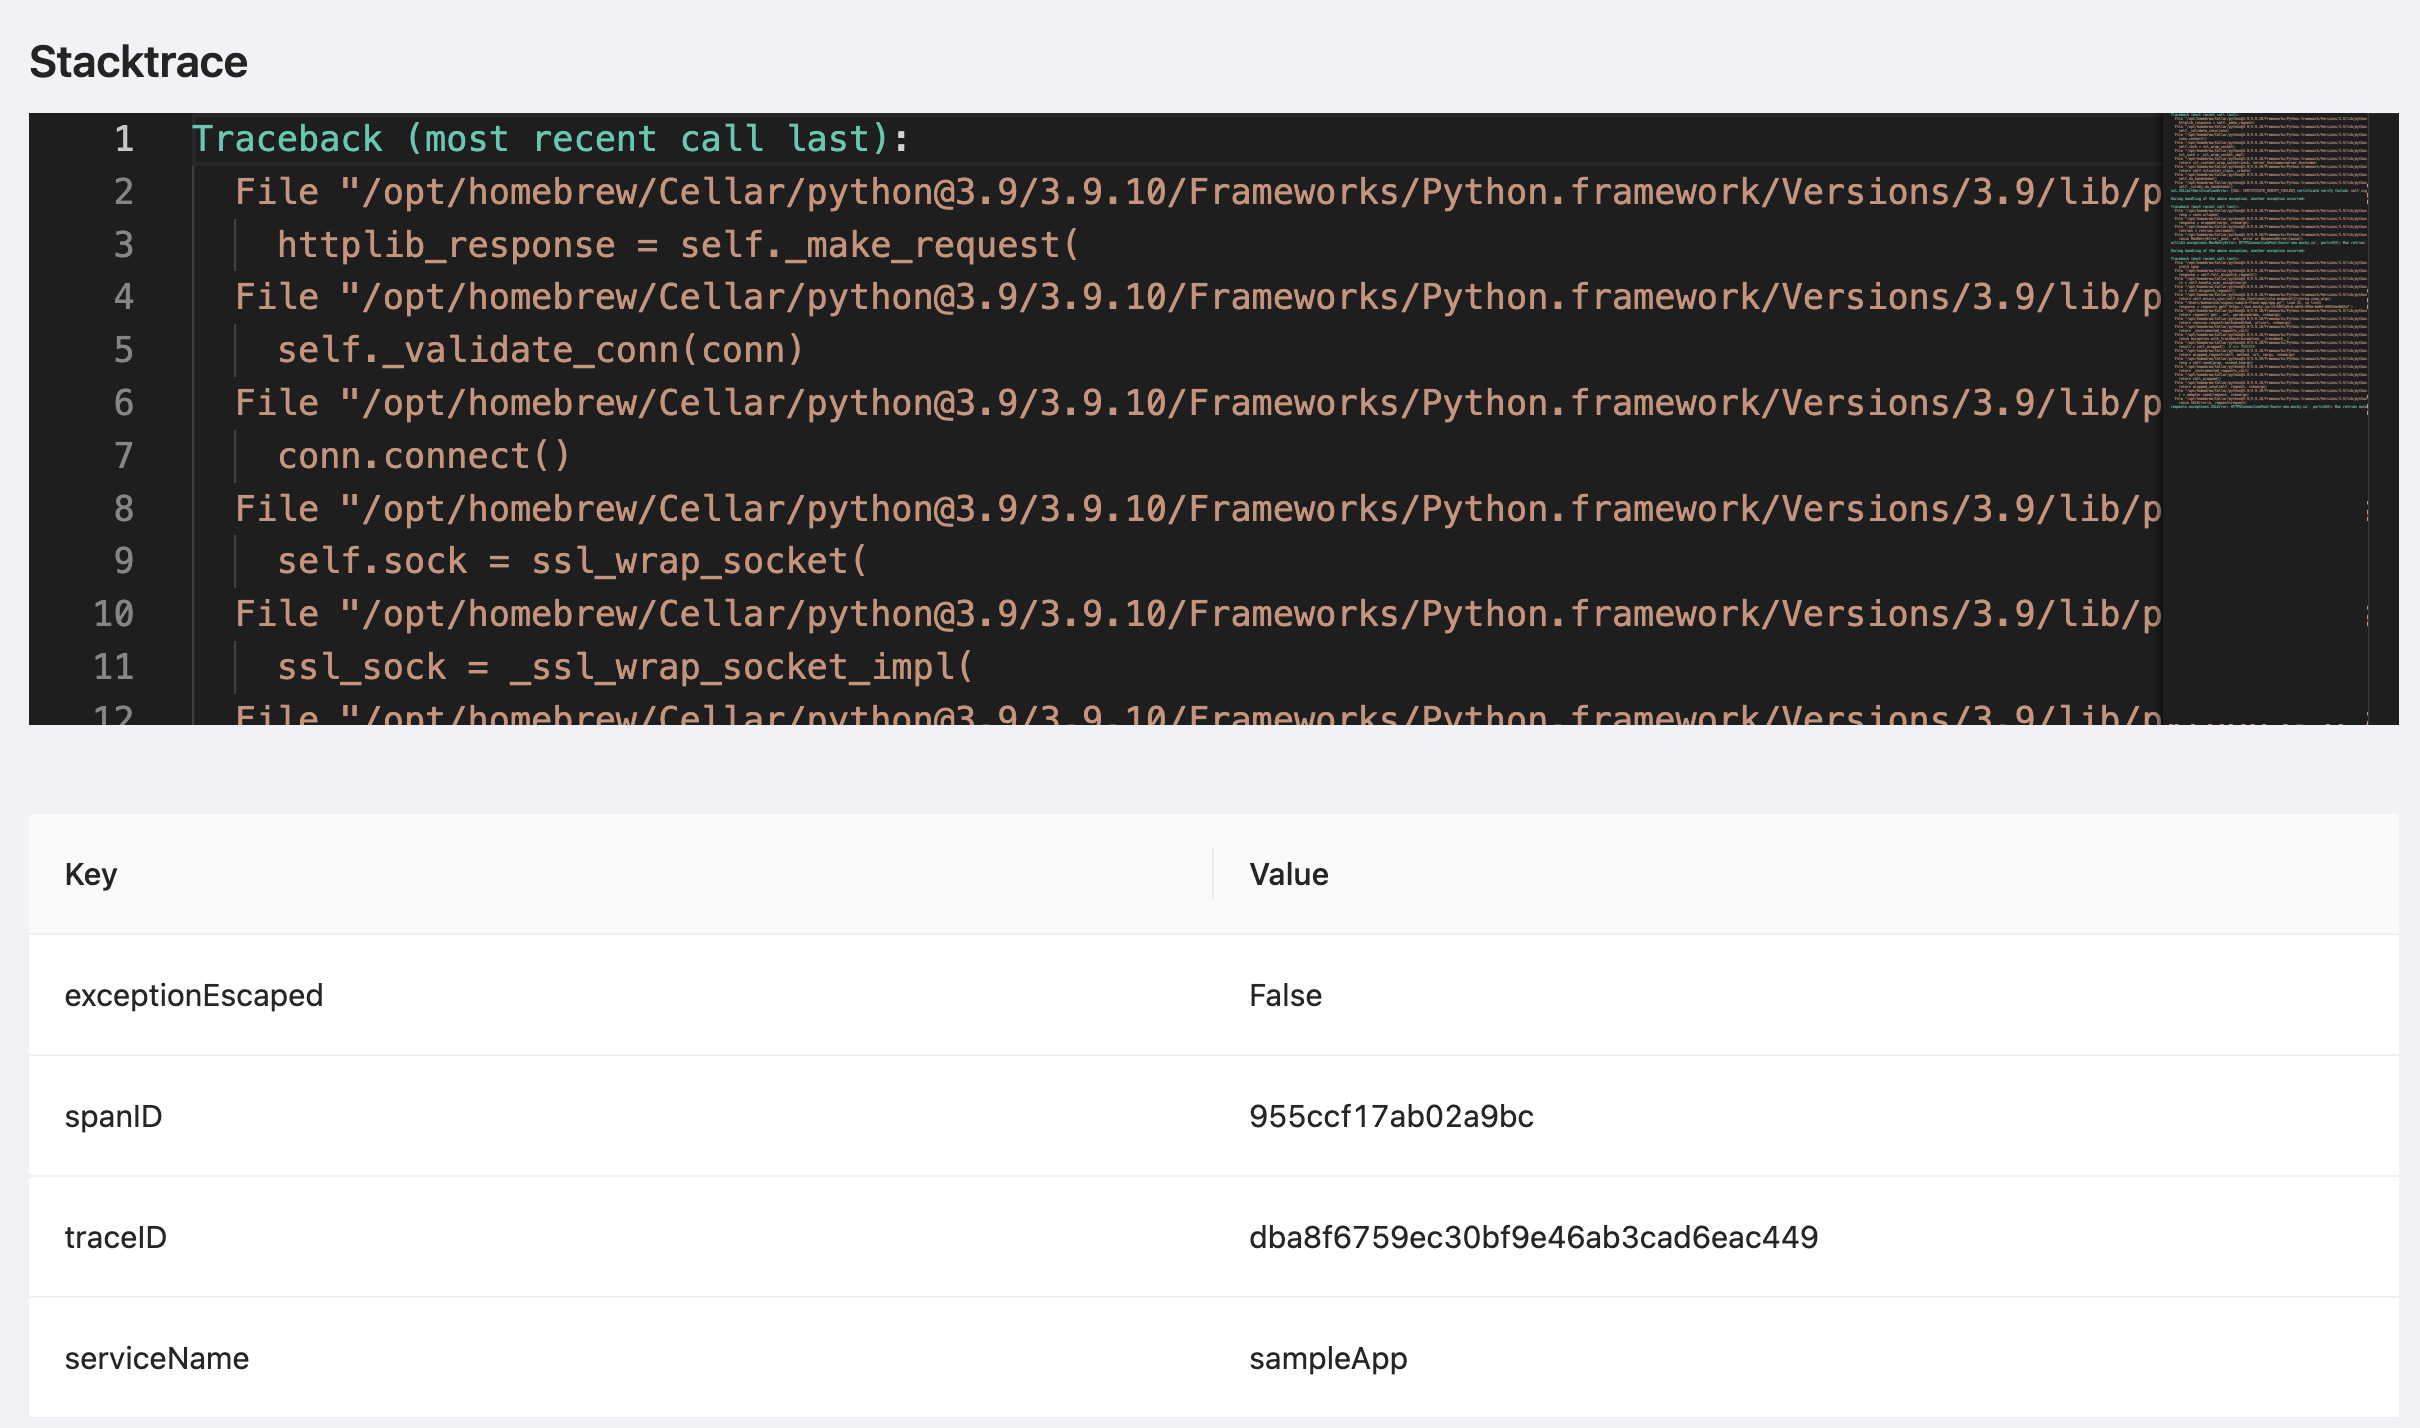
Exception detail page includes the stack trace of the exception, exception attributes and link to the span which caused the exception.

By clicking errors in the trace page you can see the exceptions in the context of the trace request in which the exception was thrown
