Spring Boot OpenTelemetry Instrumentation
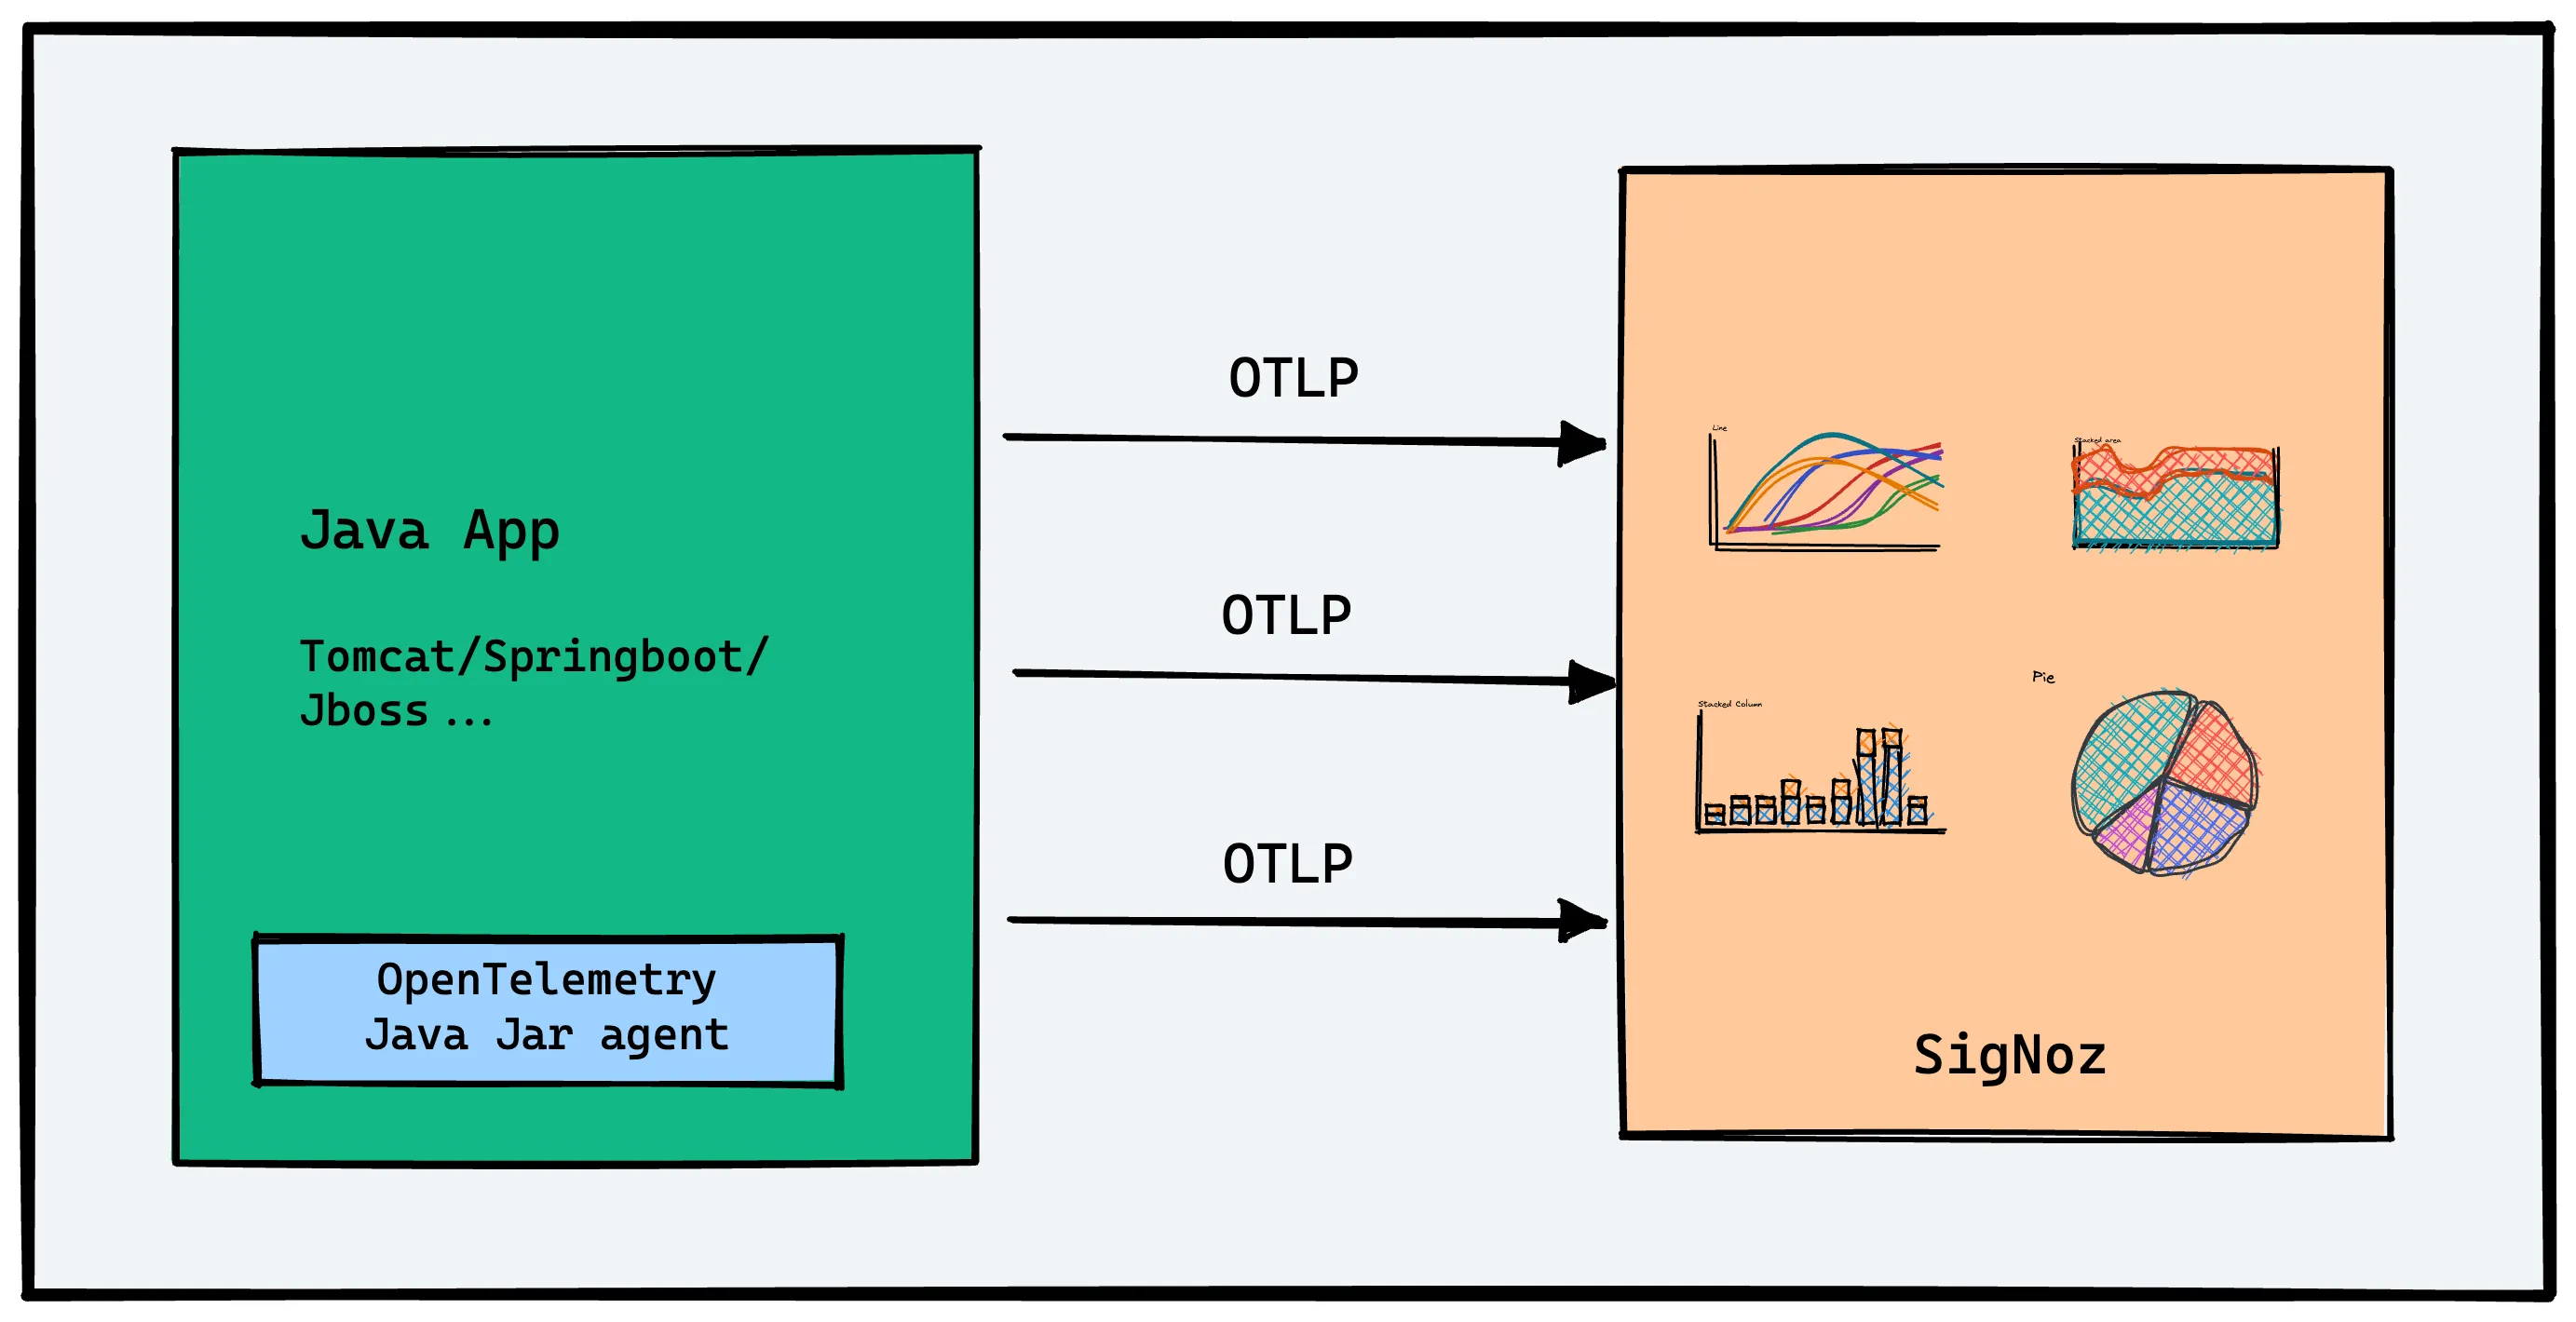
This document contains instructions on how to set up OpenTelemetry instrumentation in your Spring Boot applications. OpenTelemetry, also known as OTel for short, is an open source observability framework that can help you generate and collect telemetry data - traces, metrics, and logs from your Spring Boot application.
OpenTelemetry Java is the language-specific implementation of OpenTelemetry in Java that can be used to instrument Spring Boot applications.
Once the telemetry data is collected, you can configure an exporter to send the data to SigNoz.
There are three major steps to using OpenTelemetry:
- Instrumenting your Spring Boot application with OpenTelemetry
- Configuring exporter to send data to SigNoz
- Validating that configuration to ensure that data is being sent as expected.

There are two types of application instrumentation:
Auto Instrumentation
A completely automatic and out of box experience, with minimal code changes. For your Spring Boot application, we recommend getting started with auto instrumentation.Manual Instrumentation
It involves writing instrumentation using OpenTelemetry SDK and API manually. You would need to get a handle to an instance of theOpenTelemetryinterface, acquire a tracer, and create spans manually.
Let’s understand how to download, install, and run OpenTelemetry in a Spring Boot application.
Requirements
Java 8 or higher
Traces
You can use OpenTelemetry Java to send your traces directly to SigNoz. OpenTelemetry provides a handy Java JAR agent that can be attached to any Java 8+ application and dynamically injects bytecode to capture telemetry from a number of popular libraries and frameworks.
Steps to auto-instrument Spring Boot applications for traces
OpenTelemetry Java auto-instrumentation supports collecting telemetry data from a huge number of libraries and frameworks. You can check out the full list here.
Download the latest OpenTelemetry Java JAR agent
Download the latest Java JAR agent. You can also use the terminal to get the file using the following command:wget https://github.com/open-telemetry/opentelemetry-java-instrumentation/releases/latest/download/opentelemetry-javaagent.jar
Enable the instrumentation agent and run your application
If you run your Spring Boot application as a JAR file, run your application using the following command:OTEL_EXPORTER_OTLP_ENDPOINT="http://<IP of SigNoz Backend>:4317" OTEL_RESOURCE_ATTRIBUTES=service.name=<app_name> java -javaagent:/path/to/opentelemetry-javaagent.jar -jar <myapp>.jarwhere <app_name> is the name you want to set for your application.
pathshould be updated to the path of the downloaded Java JAR agent.In the above command, we are configuring the exporter to send data to SigNoz backend. By default, OpenTelemetry Java agent uses OTLP exporter configured to send data.
Two things to note about the command:
OTEL_EXPORTER_OTLP_ENDPOINT- This is the endpoint of the machine where SigNoz is installed.path/to- Update it to the path of your downloaded Java JAR agent.If you have installed SigNoz on your
localhostand your Java JAR agent is saved at/Users/john/Downloads/, then the final command looks like:OTEL_EXPORTER_OTLP_ENDPOINT="http://localhost:4317" OTEL_RESOURCE_ATTRIBUTES=service.name=javaApp java -javaagent:/Users/john/Downloads/opentelemetry-javaagent.jar -jar target/*.jarHere’s a handy grid to figure out which address to use to send data to SigNoz.
You can also specify environment variables in the following way:
java -javaagent:/path/opentelemetry-javaagent.jar \
    -Dotel.exporter.otlp.endpoint=http://<IP of SigNoz Backend>:4317 \
    -Dotel.resource.attributes=service.name=<app_name> \
    -jar <myapp>.jar
note
💡 Remember to allow incoming requests to port 4317 of the machine where SigNoz backend is hosted.
If you want to try this instrumentation with a sample Spring Boot application, visit this GitHub repo.
Validating instrumentation by checking for traces
With your application running, you can verify that you’ve instrumented your application with OpenTelemetry correctly by confirming that tracing data is being reported to SigNoz.
To do this, you need to ensure that your application generates some data. Applications will not produce traces unless they are being interacted with, and OpenTelemetry will often buffer data before sending. So you need to interact with your application and wait for some time to see your tracing data in SigNoz.
Validate your traces in SigNoz:
- Trigger an action in your app that generates a web request. Hit the endpoint a number of times to generate some data. Then, wait for some time.
- In SigNoz, open the
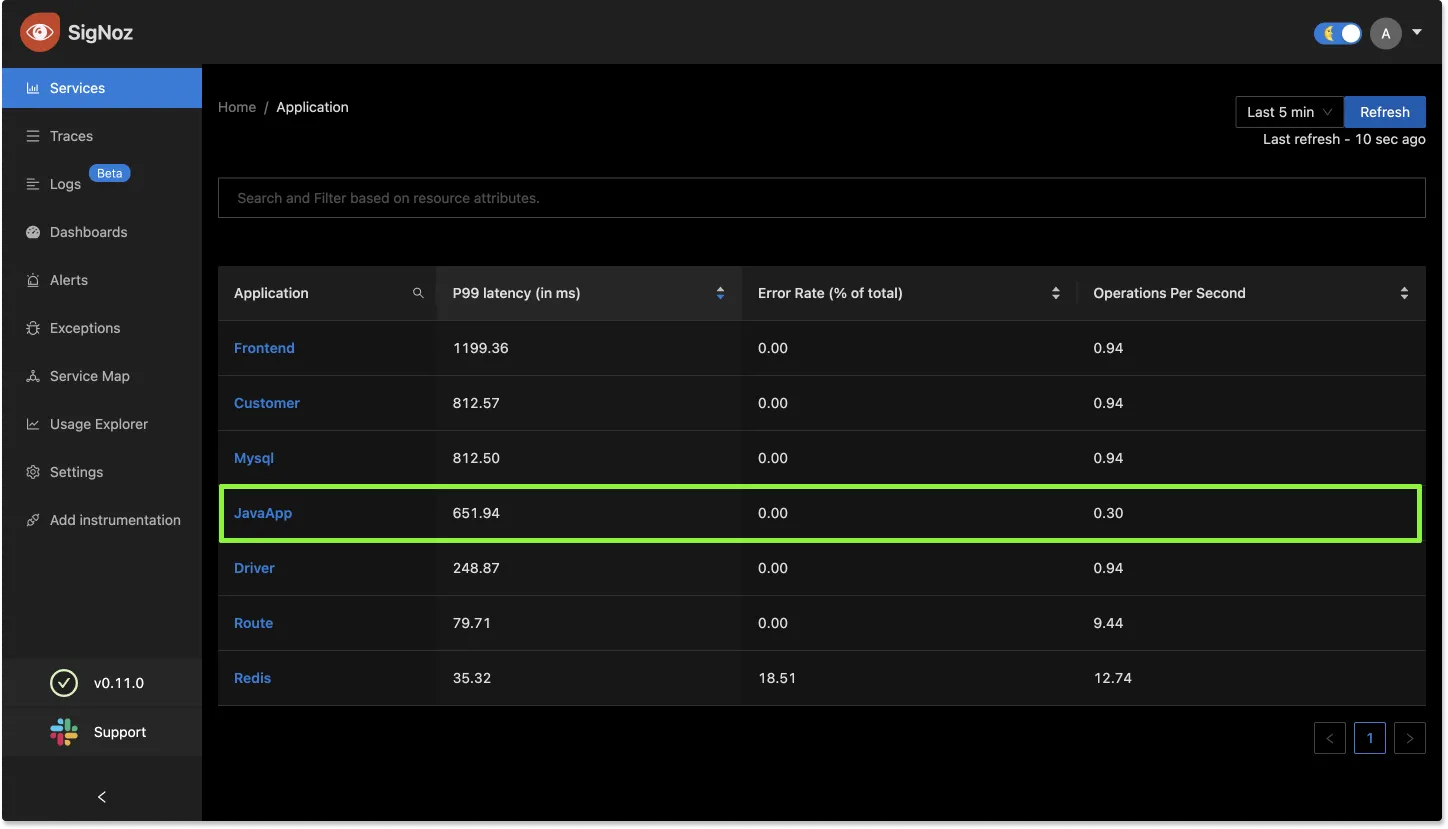
Servicestab. Hit theRefreshbutton on the top right corner, and your application should appear in the list ofApplications. - Go to the
Tracestab, and apply relevant filters to see your application’s traces.
You might see other dummy applications if you’re using SigNoz for the first time. You can remove it by following the docs here.

Configuring the agent
The agent is highly configurable. You can check out all the configuration options available here.
Disabled instrumentations
Some instrumentations can produce too many spans and make traces very noisy. For this reason, the following instrumentations are disabled by default:
jdbc-datasourcewhich creates spans whenever thejava.sql.DataSource#getConnectionmethod is called.dropwizard-metrics, which might create very low-quality metrics data because of the lack of label/attribute support in the Dropwizard metrics API.
To enable them, add the otel.instrumentation.<name>.enabled system property: -Dotel.instrumentation.jdbc-datasource.enabled=true
Manual Instrumentation
For manual instrumentation of Java application, refer to the docs here.
Troubleshooting your installation
If spans are not being reported to SigNoz, try running in debug mode by setting OTEL_LOG_LEVEL=debug:
The debug log level will print out the configuration information. It will also emit every span to the console, which should look something like:
Span {
  attributes: {},
  links: [],
  events: [],
  status: { code: 0 },
  endTime: [ 1597810686, 885498645 ],
  _ended: true,
  _duration: [ 0, 43333 ],
  name: 'bar',
  spanContext: {
    traceId: 'eca3cc297720bd705e734f4941bca45a',
    spanId: '891016e5f8c134ad',
    traceFlags: 1,
    traceState: undefined
  },
  parentSpanId: 'cff3a2c6bfd4bbef',
  kind: 0,
  startTime: [ 1597810686, 885455312 ],
  resource: Resource { labels: [Object] },
  instrumentationLibrary: { name: 'example', version: '*' },
  _logger: ConsoleLogger {
    debug: [Function],
    info: [Function],
    warn: [Function],
    error: [Function]
  },
  _traceParams: {
    numberOfAttributesPerSpan: 32,
    numberOfLinksPerSpan: 32,
    numberOfEventsPerSpan: 128
  },
  _spanProcessor: MultiSpanProcessor { _spanProcessors: [Array] }
},
Frequently Asked Questions
How to find what to use in
IP of SigNozif I have installed SigNoz in Kubernetes cluster?Based on where you have installed your application and where you have installed SigNoz, you need to find the right value for this. Please use this grid to find the value you should use for
IP of SigNozI am sending data from my application to SigNoz, but I don't see any events or graphs in the SigNoz dashboard. What should I do?
This could be because of one of the following reasons:
Your application is generating telemetry data, but not able to connect with SigNoz installation
Please use this troubleshooting guide to find if your application is able to access SigNoz installation and send data to it.
Your application is not actually generating telemetry data
Please check if the application is generating telemetry data first. You can use
Console Exporterto just print your telemetry data in console first. Join our Slack Community if you need help on how to export your telemetry data in consoleYour SigNoz installation is not running or behind a firewall
Please double check if the pods in SigNoz installation are running fine.
docker psorkubectl get pods -n platformare your friends for this.