Flask OpenTelemetry Instrumentation
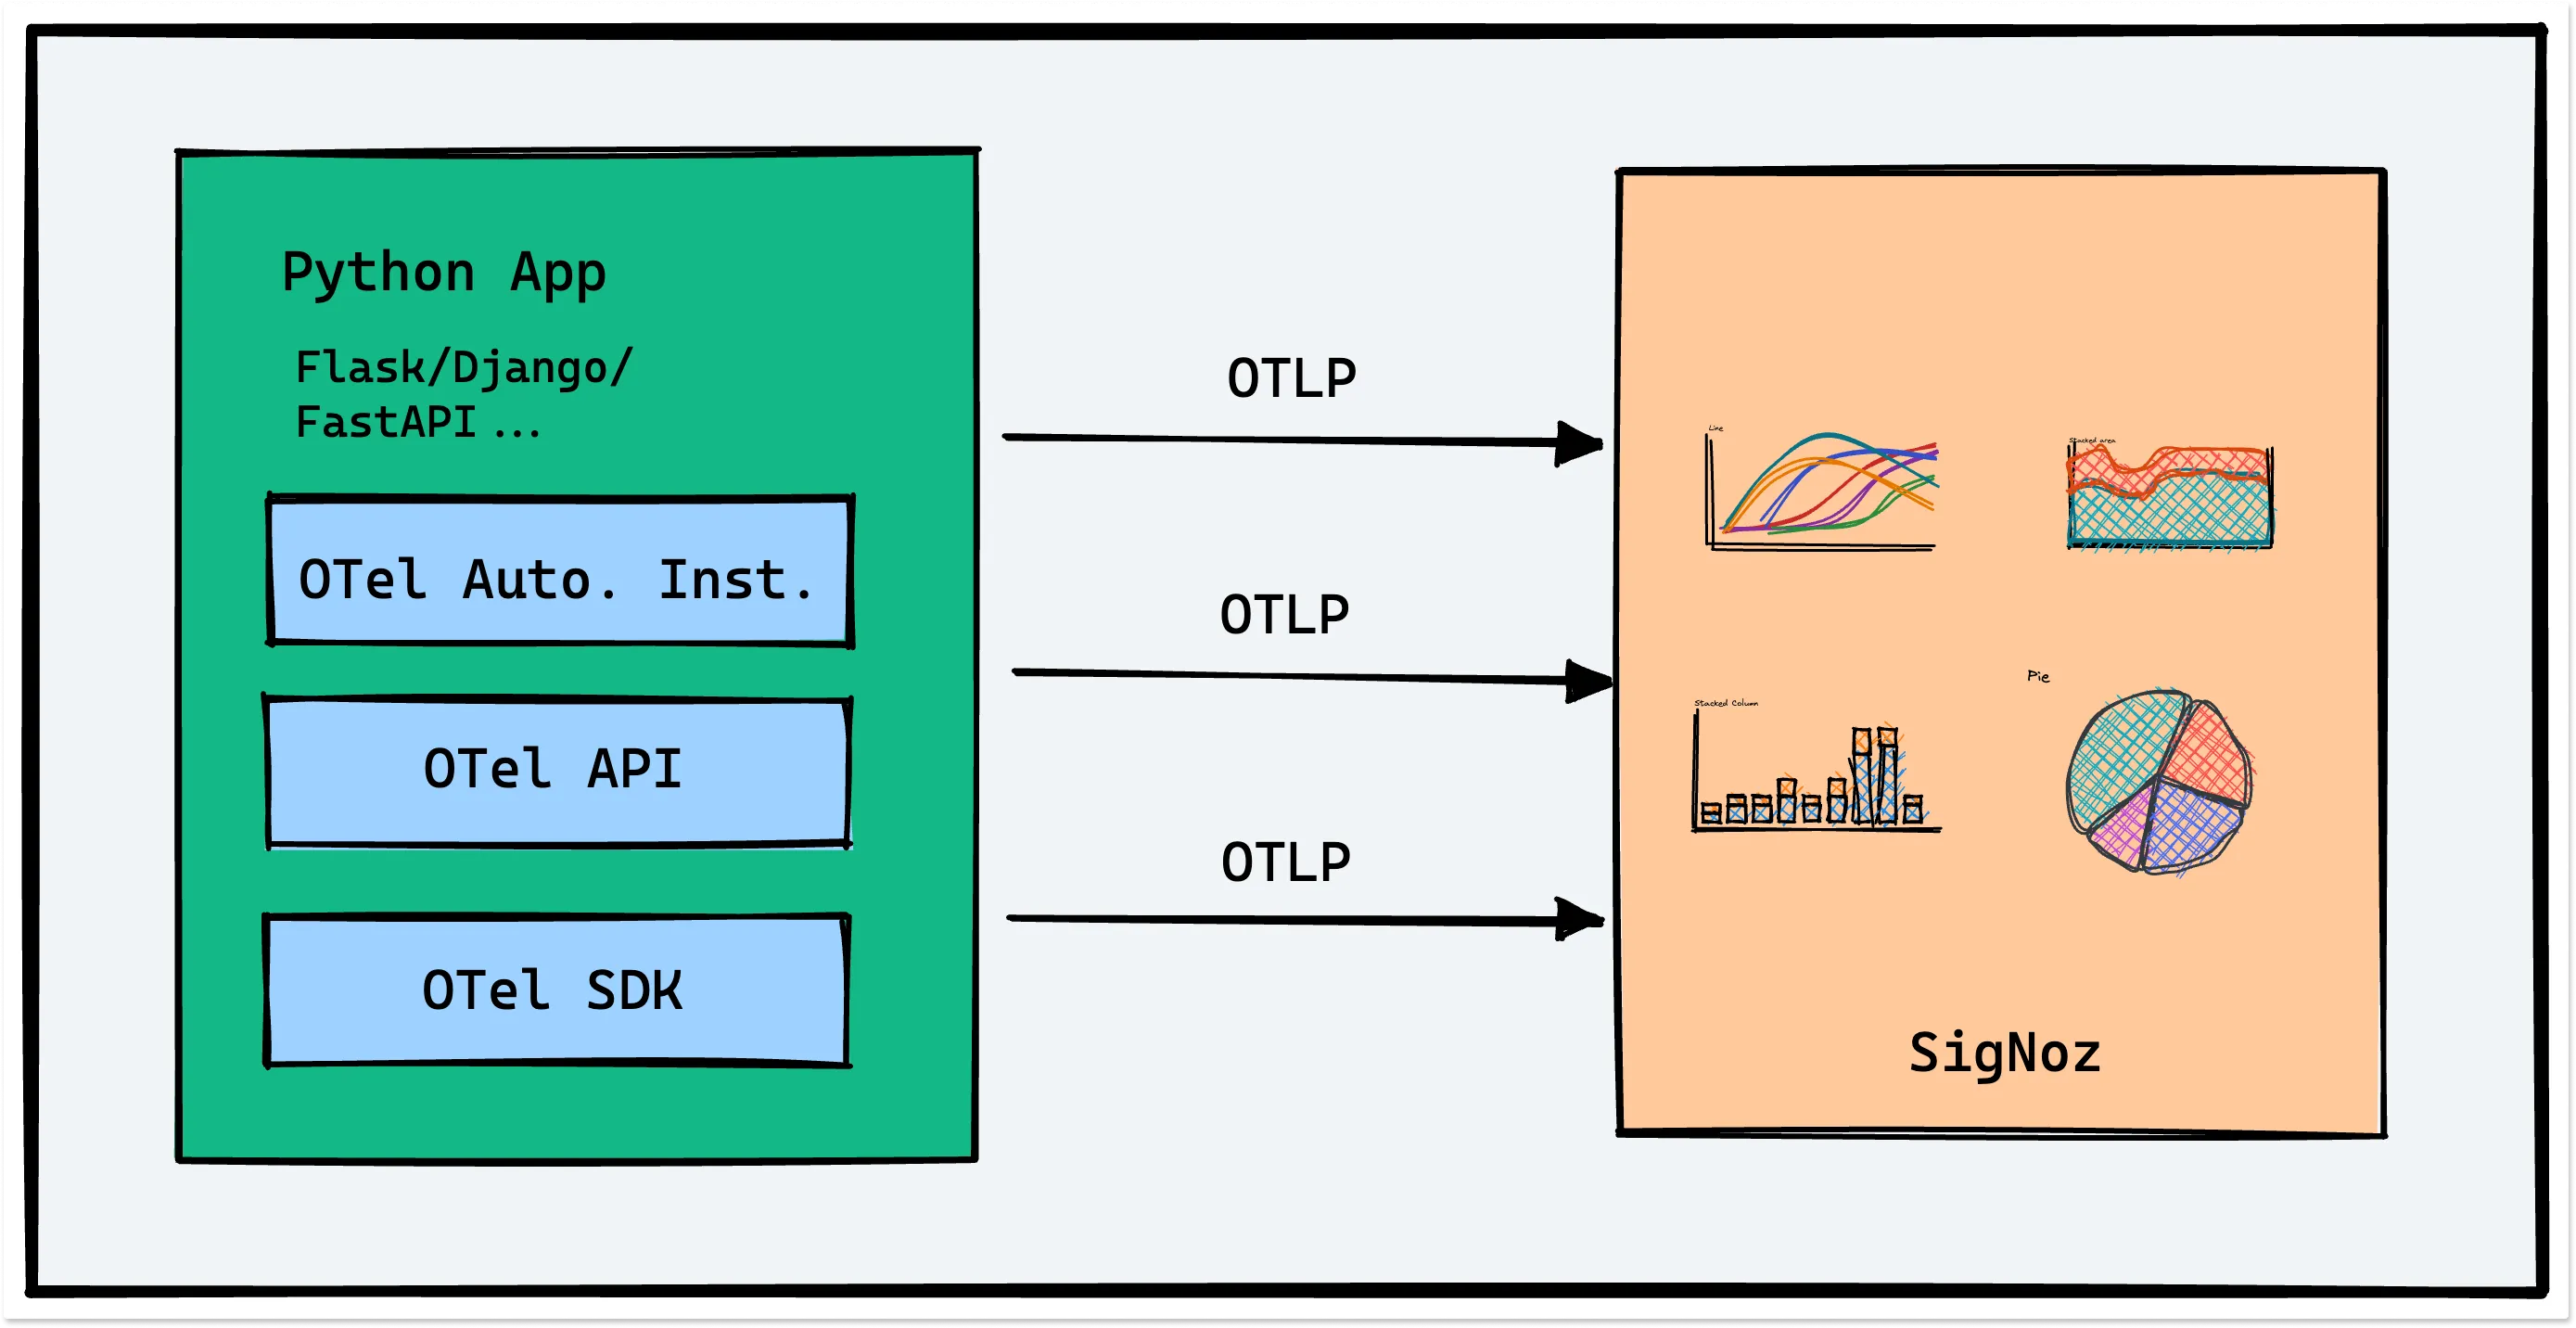
This document contains instructions on how to set up OpenTelemetry instrumentation in your Flask applications. OpenTelemetry, also known as OTel for short, is an open source observability framework that can help you generate and collect telemetry data - traces, metrics, and logs from your Flask application.
Once the telemetry data is collected, you can configure an exporter to send the data to SigNoz.
There are three major steps to using OpenTelemetry:
- Instrumenting your Flask application with OpenTelemetry
- Configuring exporter to send data to SigNoz
- Validating that configuration to ensure that data is being sent as expected.

Let’s understand how to download, install, and run OpenTelemetry in Flask.
Requirements
- Python 3.6 or newer
Traces
You can use OpenTelemetry to send your traces directly to SigNoz. OpenTelemetry provides a handy distro in Python that can help you get started with automatic instrumentation. We recommend using it to get started quickly.
Steps to auto-instrument Flask app for traces
Create a virtual environment
python3 -m venv instrumentation_env
source instrumentation_env/bin/activateInstall the OpenTelemetry dependencies
pip install opentelemetry-distro
pip install opentelemetry-exporter-otlpThe dependencies included are briefly explained below:
opentelemetry-distro- The distro provides a mechanism to automatically configure some of the more common options for users. It helps to get started with OpenTelemetry auto-instrumentation quickly.opentelemetry-exporter-otlp- This library provides a convenient way to install all supported OpenTelemetry Collector Exporters. You will need an exporter to send the data to SigNoz.note
💡 The
opentelemetry-exporter-otlpis a convenient way to install all supported OpenTelemetry exporters. Currently it installs:- opentelemetry-exporter-otlp-proto-http
- opentelemetry-exporter-otlp-proto-grpc
We recommend using the http exporter for sending data to SigNoz.
If it hangs while installing grpcio during pip3 install opentelemetry-exporter-otlp then follow below steps as suggested in this stackoverflow link.
- pip3 install --upgrade pip
- python3 -m pip install --upgrade setuptools
- pip3 install --no-cache-dir --force-reinstall -Iv grpcio
Add automatic instrumentation
The below command inspects the dependencies of your application and installs the instrumentation packages relevant for your Flask application.opentelemetry-bootstrap --action=install
Run your application
In the final run command, you can configure environment variables and flags. Flags for exporters:
HTTP: otlp_proto_http
gRPC: otlp_proto_grpcWe recommend using the
otlp_proto_httpexporter.For running your application, there are a few things that you need to keep in mind. Below are the notes:
note
Don’t run app in reloader/hot-reload mode as it breaks instrumentation. For example, if you use
export Flask_ENV=development, it enables the reloader mode which breaks OpenTelemetry isntrumentation.For running applications with application servers which are based on pre fork model, like Gunicorn, uWSGI you have to add a post_fork hook or a @postfork decorator in your configuration.
To start sending data to SigNoz, use the following run command:
OTEL_RESOURCE_ATTRIBUTES=service.name=<service_name> OTEL_EXPORTER_OTLP_ENDPOINT="http://<IP of SigNoz Backend>:4318" opentelemetry-instrument --traces_exporter otlp_proto_http <your run command><service_name> is the name of service you want
<your_run_command> can be
python3 app.pyorflask runIP of SigNoz backendis the IP of the machine where you installed SigNoz. If you have installed SigNoz onlocalhost, the endpoint will behttp://localhost:4318.note
The port numbers are 4317 and 4318 for the gRPC and HTTP exporters respectively. Remember to allow incoming requests to port 4317/4318 of machine where SigNoz backend is hosted.
Validating instrumentation by checking for traces
With your application running, you can verify that you’ve instrumented your application with OpenTelemetry correctly by confirming that tracing data is being reported to SigNoz.
To do this, you need to ensure that your application generates some data. Applications will not produce traces unless they are being interacted with, and OpenTelemetry will often buffer data before sending. So you need to interact with your application and wait for some time to see your tracing data in SigNoz.
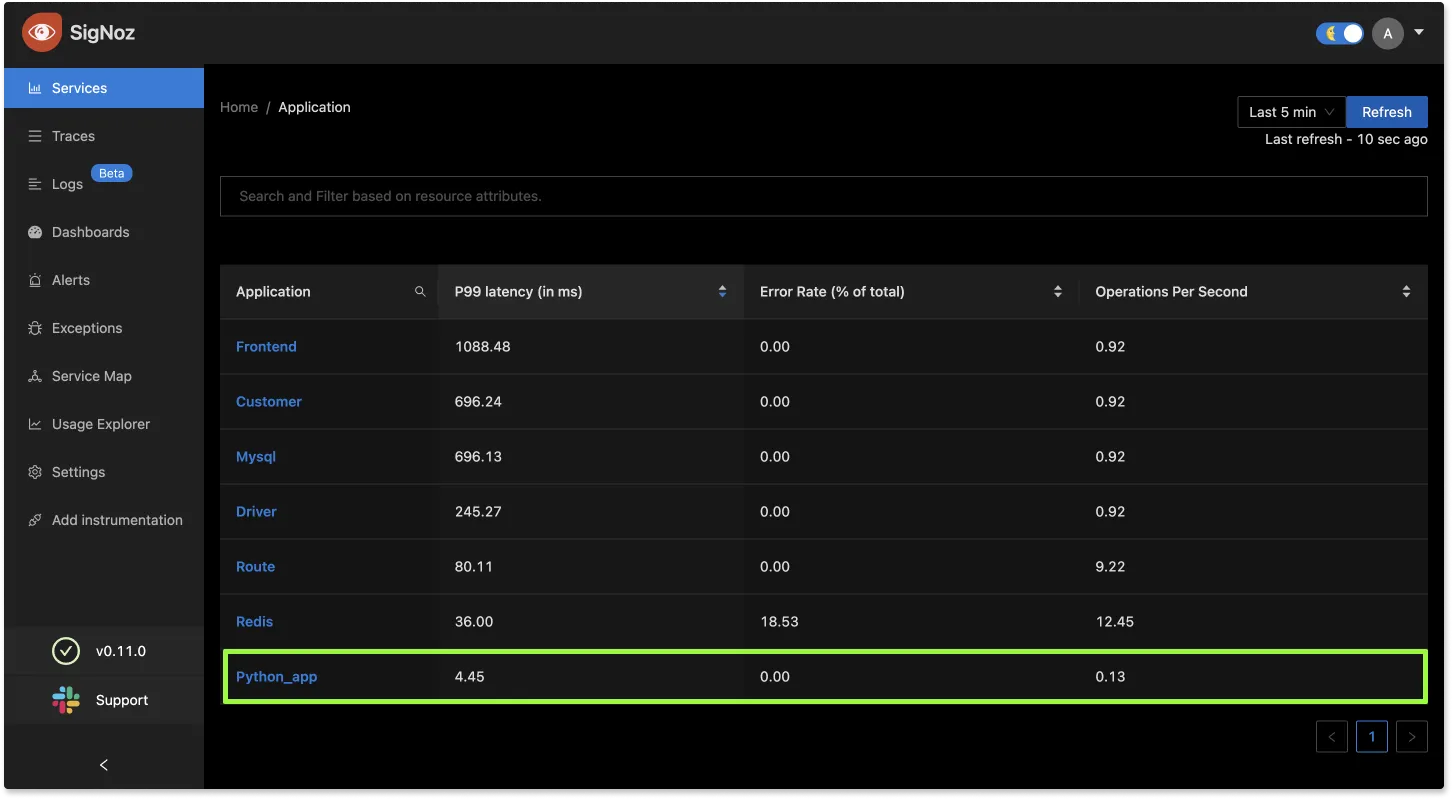
Validate your traces in SigNoz:
- Trigger an action in your app that generates a web request. Hit the endpoint a number of times to generate some data. Then, wait for some time.
- In SigNoz, open the
Servicestab. Hit theRefreshbutton on the top right corner, and your application should appear in the list ofApplications. - Go to the
Tracestab, and apply relevant filters to see your application’s traces.
You might see other dummy applications if you’re using SigNoz for the first time. You can remove it by following the docs here.

Database Instrumentation
Make sure that the DB client library you are using has the corresponding instrumentation library, and the version of the DB client library is supported by OpenTelemetry.
MongoDB
You can use opentelemetry-distro to initialize instrumentation for your MongoDB database calls. You need to ensure that the version of your DB client library is supported by OpenTelemetry. For MongoDB, the instrumentation library is opentelemetry-instrumentation-pymongo.
You can check the supported versions here.
Redis
You can use opentelemetry-distro to initialize instrumentation for your Redis database calls. You need to ensure that the version of your DB client library is supported by OpenTelemetry. For Redis, the instrumentation library is opentelemetry-instrumentation-redis.
You can check the supported versions here.
MySQL
You can use opentelemetry-distro to initialize instrumentation for your MySQL database calls. You need to ensure that the version of your DB client library is supported by OpenTelemetry. For MySQL, we have two isntrumentation libraries:
- opentelemetry-instrumentation-mysql
- opentelemetry-instrumentation-pymysql
You can check the supported versions here.
Postgres
You can use opentelemetry-distro to initialize instrumentation for your PostgreSQL database calls. You need to ensure that the version of your DB client library is supported by OpenTelemetry. For Postgres, the instrumentation library is opentelemetry-instrumentation-psycopg2.
You can check the supported versions here.
note
psycopg2-binary is not supported by opentelemetry auto instrumentation libraries as it is not recommended for production use. Please use psycopg2 to see DB calls also in your trace data in SigNoz
Running applications with Gunicorn, uWSGI
For application servers which are based on pre fork model like Gunicorn, uWSGI you have to add a post_fork hook or a @postfork decorator in your configuration.
Check this documentation from OpenTelemetry on how to set it up.
Here's a working example where we have configured a gunicorn server with post_fork hook.
Troubleshooting your installation
Spans are not being reported
If spans are not being reported to SigNoz, try enabling debug exporter which writes the json formatted trace data to console.
opentelemetry-instrument --traces_exporter otlp_proto_http,console <your run command>:
{
    "name": "alice",
    "context": {
        "trace_id": "0xedb7caf0c8b082a9578460a201759193",
        "span_id": "0x57cf7eee198e1fed",
        "trace_state": "[]"
    },
    "kind": "SpanKind.INTERNAL",
    "parent_id": null,
    "start_time": "2022-03-27T14:55:18.804758Z",
    "end_time": "2022-03-27T14:55:18.804805Z",
    "status": {
        "status_code": "UNSET"
    },
    "attributes": {},
    "events": [],
    "links": [],
    "resource": {
        "telemetry.sdk.language": "python",
        "telemetry.sdk.name": "opentelemetry",
        "telemetry.sdk.version": "1.10.0",
        "service.name": "my-service"
    }
}
Frequently Asked Questions
How to find what to use in
IP of SigNozif I have installed SigNoz in Kubernetes cluster?Based on where you have installed your application and where you have installed SigNoz, you need to find the right value for this. Please use this grid to find the value you should use for
IP of SigNozI am sending data from my application to SigNoz, but I don't see any events or graphs in the SigNoz dashboard. What should I do?
This could be because of one of the following reasons:
Your application is generating telemetry data, but not able to connect with SigNoz installation
Please use this troubleshooting guide to find if your application is able to access SigNoz installation and send data to it.
Your application is not actually generating telemetry data
Please check if the application is generating telemetry data first. You can use
Console Exporterto just print your telemetry data in console first. Join our Slack Community if you need help on how to export your telemetry data in consoleYour SigNoz installation is not running or behind a firewall
Please double check if the pods in SigNoz installation are running fine.
docker psorkubectl get pods -n platformare your friends for this.