In this post, we will show you how to set up Redis monitoring with SigNoz - an open-source full-stack APM. SigNoz captures data using OpenTelemetry, which is becoming the world standard for instrumenting cloud-native applications. Apart from capturing metrics from your Redis server, you can also capture logs and traces with OpenTelemetry.
What is OpenTelemetry?
OpenTelemetry is an open-source collection of tools, APIs, and SDKs that aims to standardize how we generate and collect telemetry data. It follows a specification-driven development. The OpenTelemetry specification has design and implementation guidelines for how the instrumentation libraries should be implemented.
OpenTelemetry is incubated under Cloud Native Computing Foundation (CNCF), the same foundation which incubated Kubernetes. OpenTelemetry solves the challenge of instrumenting polyglot cloud-native applications. The client libraries enable a consistent instrumentation experience in multiple programming languages. OpenTelemetry provides a stand-alone service called the Collector. It can be used as a data processing system to create consistent data pipelines.
One of the biggest advantages of using OpenTelemetry is that it provides users the freedom to choose a backend analysis tool. It replaces proprietary SaaS agents with an open source standard consistent across the entire application architecture. OpenTelemetry enables engineering teams to reduce dependency issues by allowing access to a single knowledge base for instrumenting applications.
It does not provide a data storage and visualization layer. And that’s where SigNoz comes into the picture. SigNoz is an open source APM built to support OpenTelemetry natively. Redis metrics are captured with the help of OpenTelemetry Collector.
Collecting Redis Metrics with OpenTelemetry Collector
The client libraries of OpenTelemetry are used mainly for traces, logs, and application metrics. The Collector can receive all types of telemetry, including logs, metrics, and traces.
Redis exposes a number of performance metrics and stats through the INFO command. You can collect the Redis INFO data from a single Redis instance with the help of OpenTelemetry Collector.
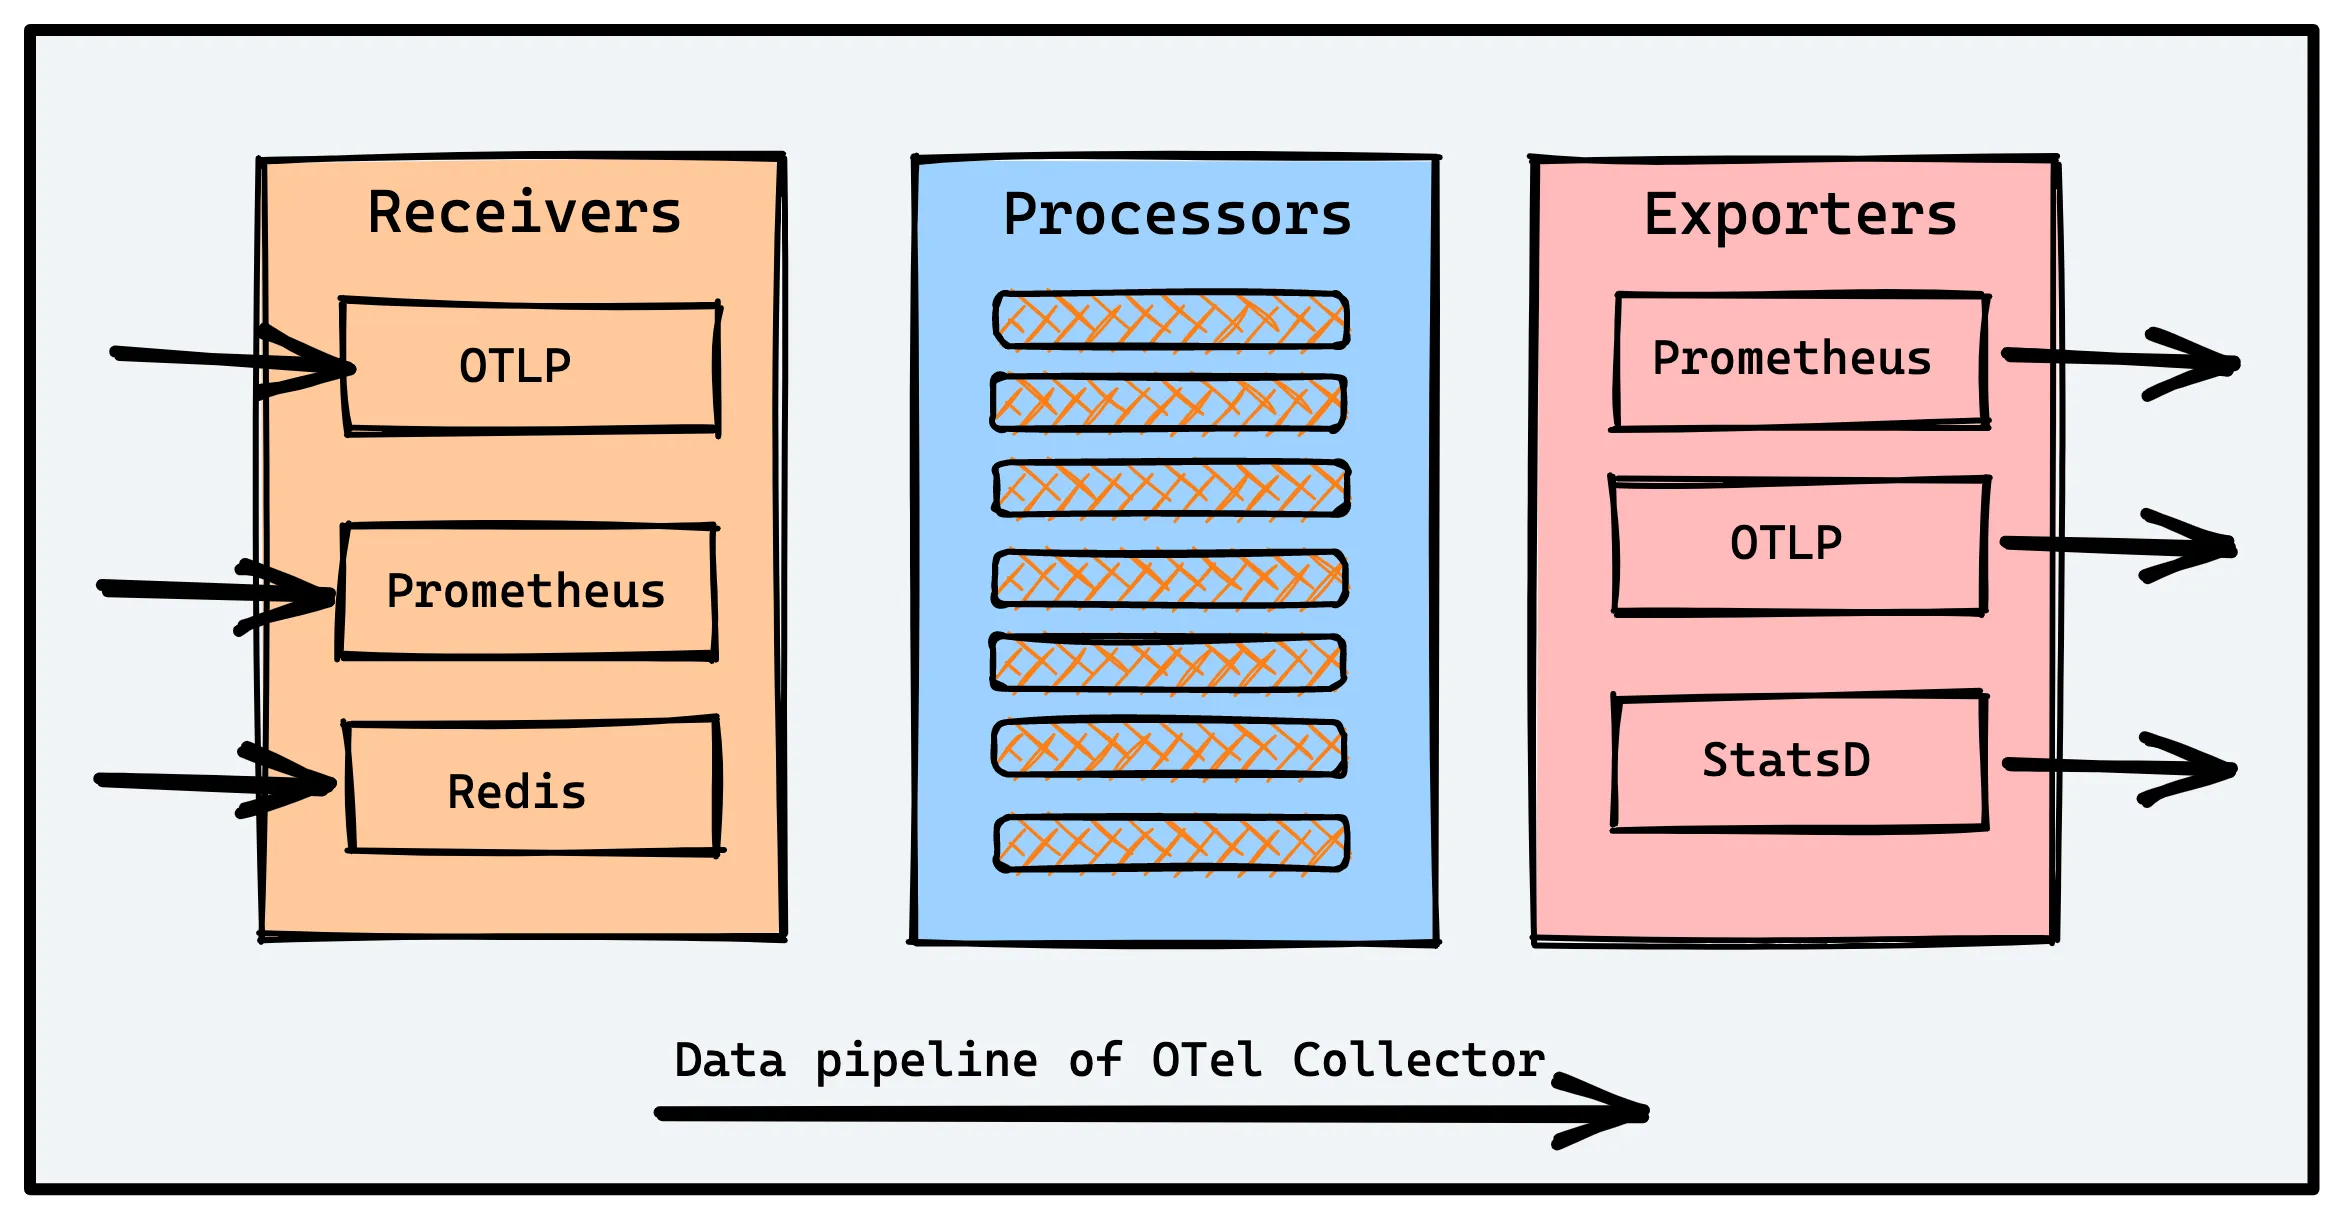
The OpenTelemetry Collector provides a telemetry processing system that can be configured to import and export data in many common formats. The three main components of OpenTelemetry Collector are:
Receivers
Receivers collect telemetry data from a variety of sources. You can check out the OpenTelemetry Redis receiver here. You can also check out the full list of OpenTelemetry receivers.Processors
Processors perform a variety of tasks like data scrubbing, data normalization, routing, and sampling.Exporters
Exporters are used to export the processed telemetry data to a variety of backends.
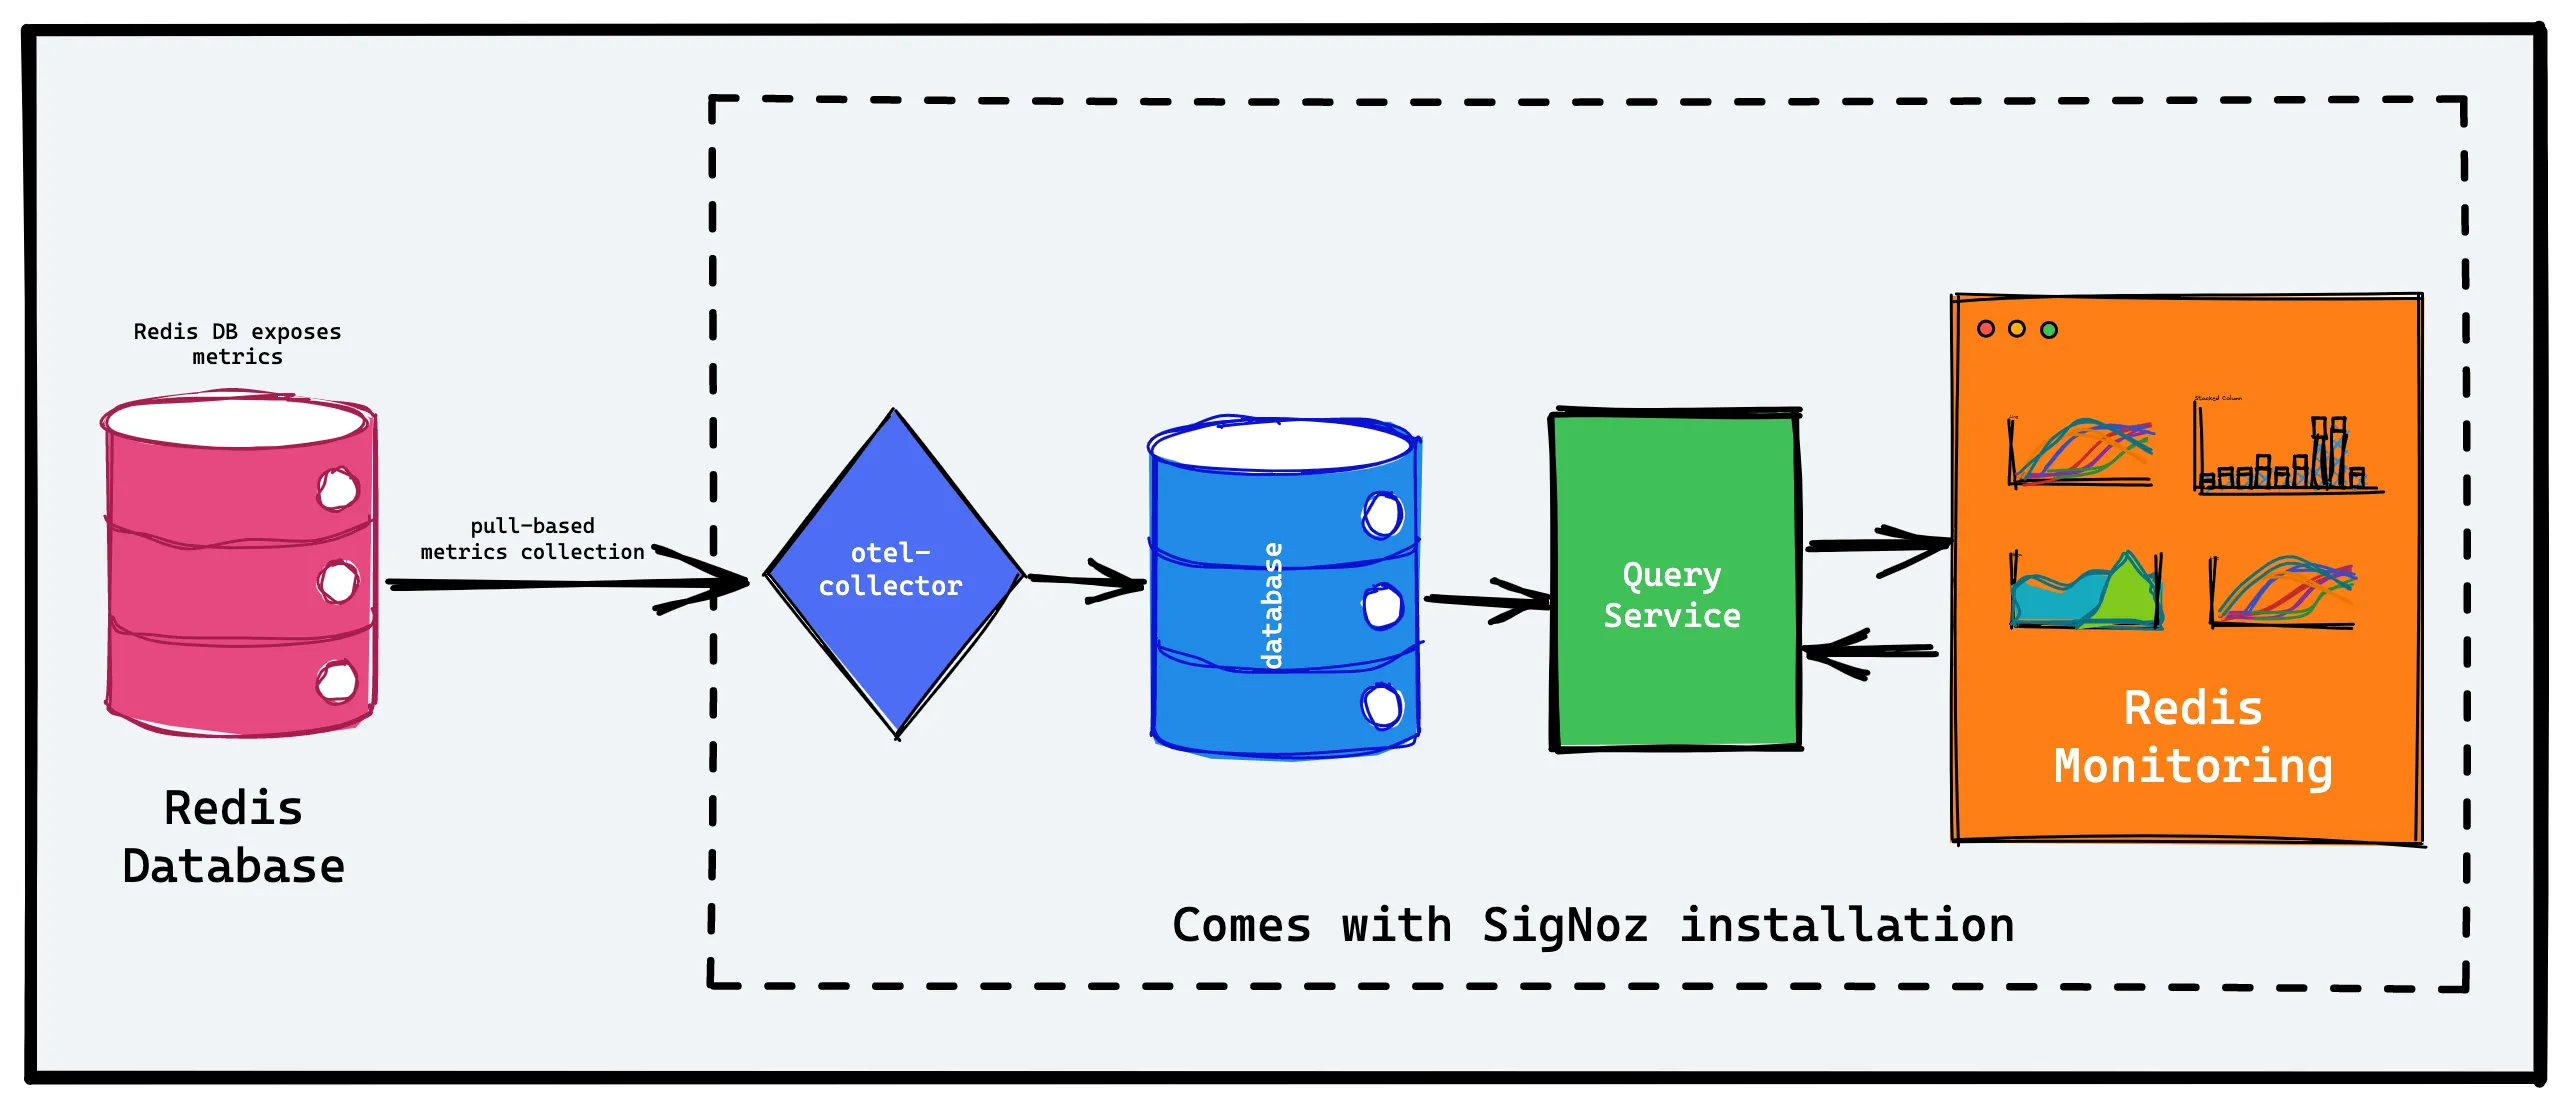
SigNoz installation ships with two instances of OpenTelemetry Collectors. One Collector is meant for push-based metrics collection, while the other is meant for pull-based metrics collection. For this post, we will be using the pull-based OpenTelemetry Collector.
The collectors write the data to ClickHouse, the database used by SigNoz. Then, a query service talks to the ClickHouse DB, as shown in the picture, to create visualizations that are served by a frontend web application.
For collecting and visualizing Redis metrics, let us first install SigNoz.
Installing SigNoz
SigNoz is an open-source APM that can be self-hosted within your infrastructure.
It is easy to get started with SigNoz. It can be installed on macOS or Linux computers in just three steps by using a simple installation script.
The install script automatically installs Docker Engine on Linux. However, you must manually install Docker Engine on macOS before running the install script.
git clone -b main https://github.com/SigNoz/signoz.git
cd signoz/deploy/
./install.sh
You can visit our documentation for instructions on how to install SigNoz using Docker Swarm and Helm Charts.
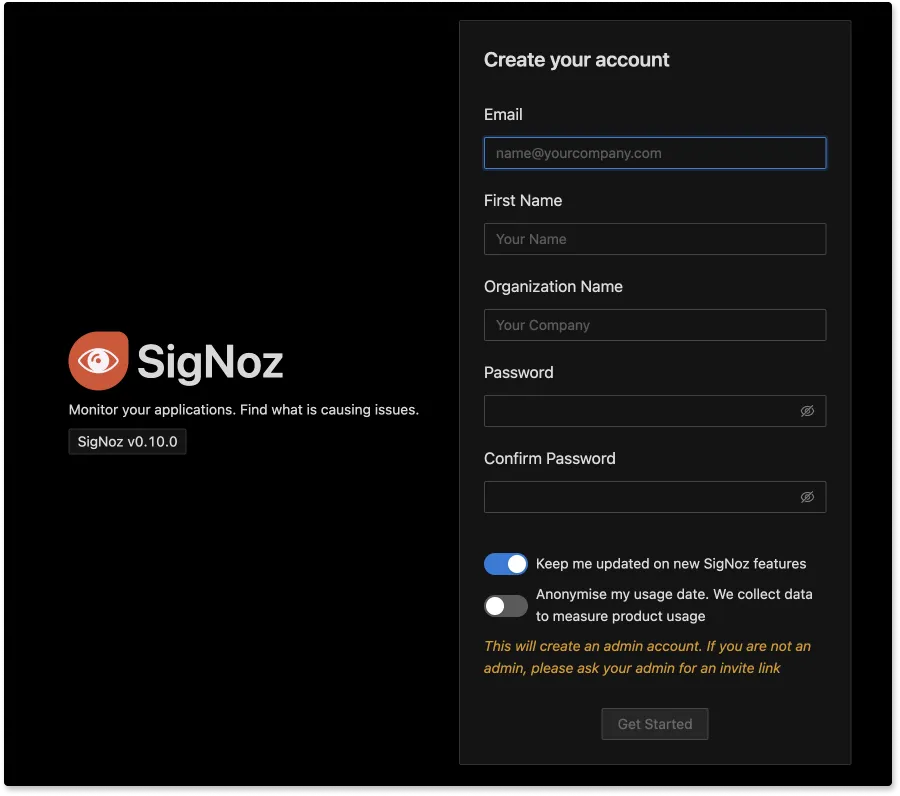
Once installed, you can access SigNoz UI at port 3301 - http://localhost:3301. You will get a sign-up page. If you’re a first-time user, you can create an account using Create an account.
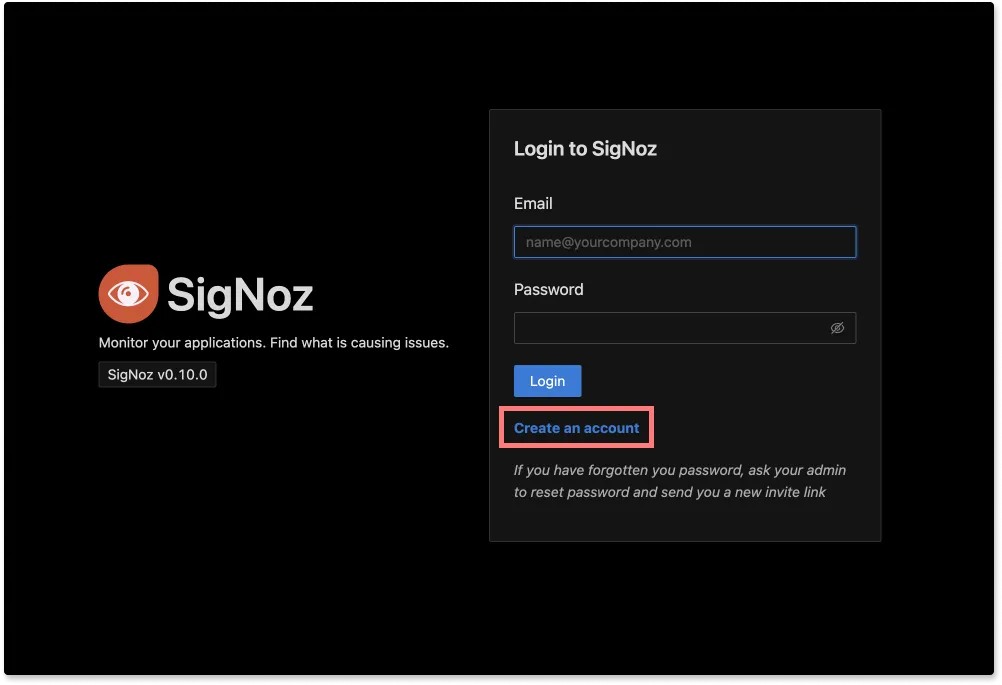
SigNoz provides role-based access control features. Creating an account for the first time creates an Admin account.
Once you sign in, you will have access to all the tabs of SigNoz. For monitoring Redis metrics, we will be using the Dashboards tab.
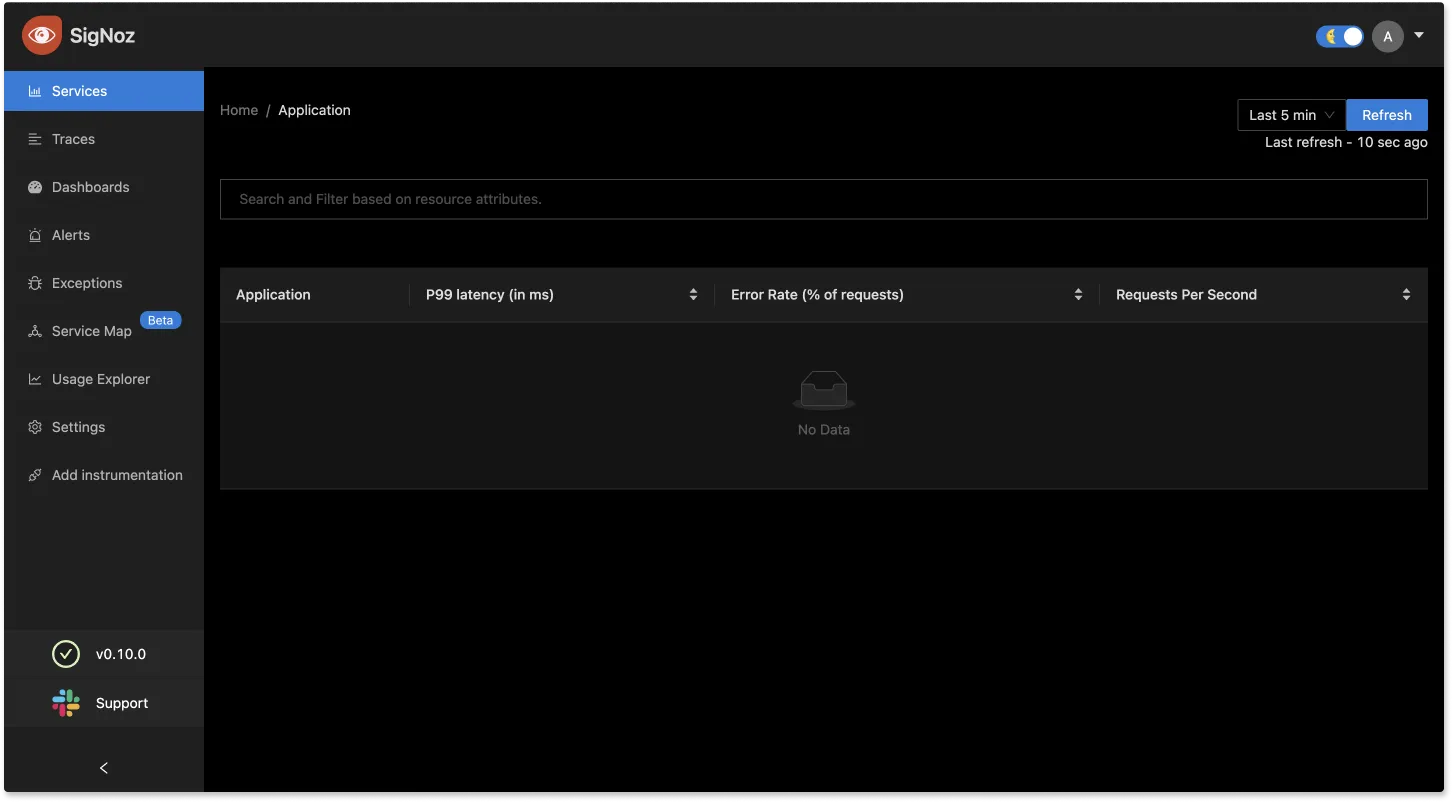
SigNoz APM dashboard - comes with metrics monitoring, distributed tracing, and exceptions monitoring, among other things.
Steps to capture Redis Metrics with Otel-Collector
First of all, ensure that your Redis server and redis-cli are running properly.
redis-cli info | grep uptime_in_seconds
If you’re running command from a different host or port, add the following arguments to the command:
redis-cli -h <host> -p <port> info | grep uptime_in_seconds
You will see an output as follows:
uptime_in_seconds:10706
Now you need to configure the OpenTelemetry Redis receiver. The collector settings are configured using yaml files.
Open up the otel-collector-metrics-config.yaml file located at the following address inside the installation folder of SigNoz:
deploy/docker/clickhouse-setup/otel-collector-metrics-config.yaml
You need to make two changes to enable OpenTelemetry Collector to receive Redis metrics:
- Enable the Redis receiver
In the config yaml file, you need to add redis as one of the receivers.receivers:
redis:
endpoint: "localhost:6379"
collection_interval: 60s
password: $REDIS_PASSWORD - Configuring the data pipeline
As mentioned above, OpenTelemetry Collectors act as a telemetry processing system with a configurable data pipeline. We will need to addredisin the data pipeline.The above pipeline sets the Redis data pipeline in which it is received as Redis metrics and exported to be written in ClickHouse, the database used by SigNoz to store telemetry data.pipelines:
metrics:
receivers: [redis, prometheus]
processors: [batch]
exporters: [clickhousemetricswrite]
You can have a look at the otel-collector-metrics-config.yaml file on our GitHub repo. The final config file along with Redis receiver looks like below:
Note: We have configured the redis endpoint for Mac for this demo. You will need to update the endpoint based on your environment.
receivers:
otlp:
protocols:
grpc:
http:
prometheus:
config:
scrape_configs:
# otel-collector internal metrics
- job_name: "otel-collector"
scrape_interval: 60s
static_configs:
- targets:
- otel-collector:8888
# otel-collector-metrics internal metrics
- job_name: "otel-collector-metrics"
scrape_interval: 60s
static_configs:
- targets:
- localhost:8888
# SigNoz span metrics
- job_name: "signozspanmetrics-collector"
scrape_interval: 60s
static_configs:
- targets:
- otel-collector:8889
#Redis metrics receiver
redis:
endpoint: "host.docker.internal:6379"
collection_interval: 60s
processors:
batch:
send_batch_size: 10000
send_batch_max_size: 11000
timeout: 10s
# memory_limiter:
# # 80% of maximum memory up to 2G
# limit_mib: 1500
# # 25% of limit up to 2G
# spike_limit_mib: 512
# check_interval: 5s
#
# # 50% of the maximum memory
# limit_percentage: 50
# # 20% of max memory usage spike expected
# spike_limit_percentage: 20
# queued_retry:
# num_workers: 4
# queue_size: 100
# retry_on_failure: true
extensions:
health_check:
endpoint: 0.0.0.0:13133
zpages:
endpoint: 0.0.0.0:55679
pprof:
endpoint: 0.0.0.0:1777
exporters:
clickhousemetricswrite:
endpoint: tcp://clickhouse:9000/?database=signoz_metrics
service:
telemetry:
metrics:
address: 0.0.0.0:8888
extensions:
- health_check
- zpages
- pprof
pipelines:
metrics:
receivers: [redis, prometheus]
processors: [batch]
exporters: [clickhousemetricswrite]
A few things to note about the Redis receiver settings. The following settings are required:
endpoint(no default): The hostname and port of the Redis instance, separated by a colon.
We have also set the collection_interval to 60s. The default value is 10s, but that can be an expensive operation.
If you have set up your Redis instance with a password, you would need to include it in the configuration settings:
receivers:
  redis:
    endpoint: "localhost:6379"
    collection_interval: 60s
    password: $REDIS_PASSWORD
The password must match the password specified in the requirepass Redis server configuration option.
Once the yaml configuration is done, you must restart your Docker containers to enable the OpenTelemetry Collector to scrape metrics from the Redis server.
In the deploy folder, run the following command at your terminal to stop Docker containers:
docker-compose -f docker/clickhouse-setup/docker-compose.yaml stop
Then use the following command to restart the Docker containers:
docker-compose -f docker/clickhouse-setup/docker-compose.yaml up
Once the containers are running again, you can use the Dashboards tab of SigNoz to create customized charts for monitoring your Redis instance.
Monitoring Redis instance with SigNoz dashboards
Click on the Dashboards and then + New Dashboards. A dashboard is composed of panels in SigNoz.

You can create two different types of panels: Time Series and Value, based on your use case.
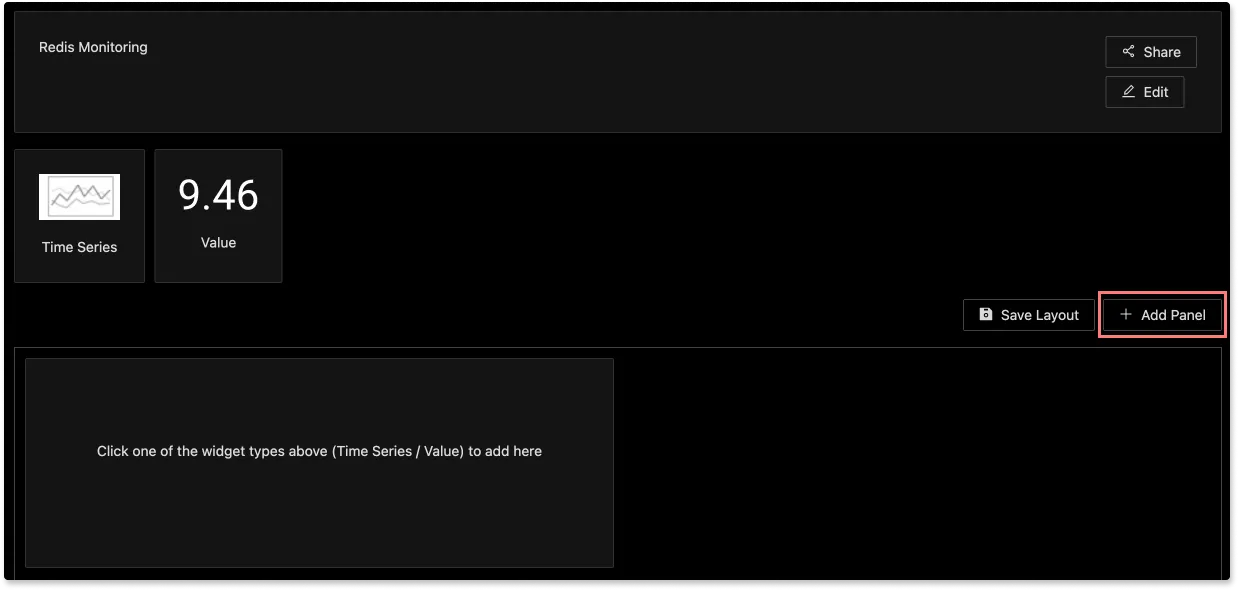
Once you click on + Add panel , you will have access to a DIY metrics query builder to create the charts that you need.
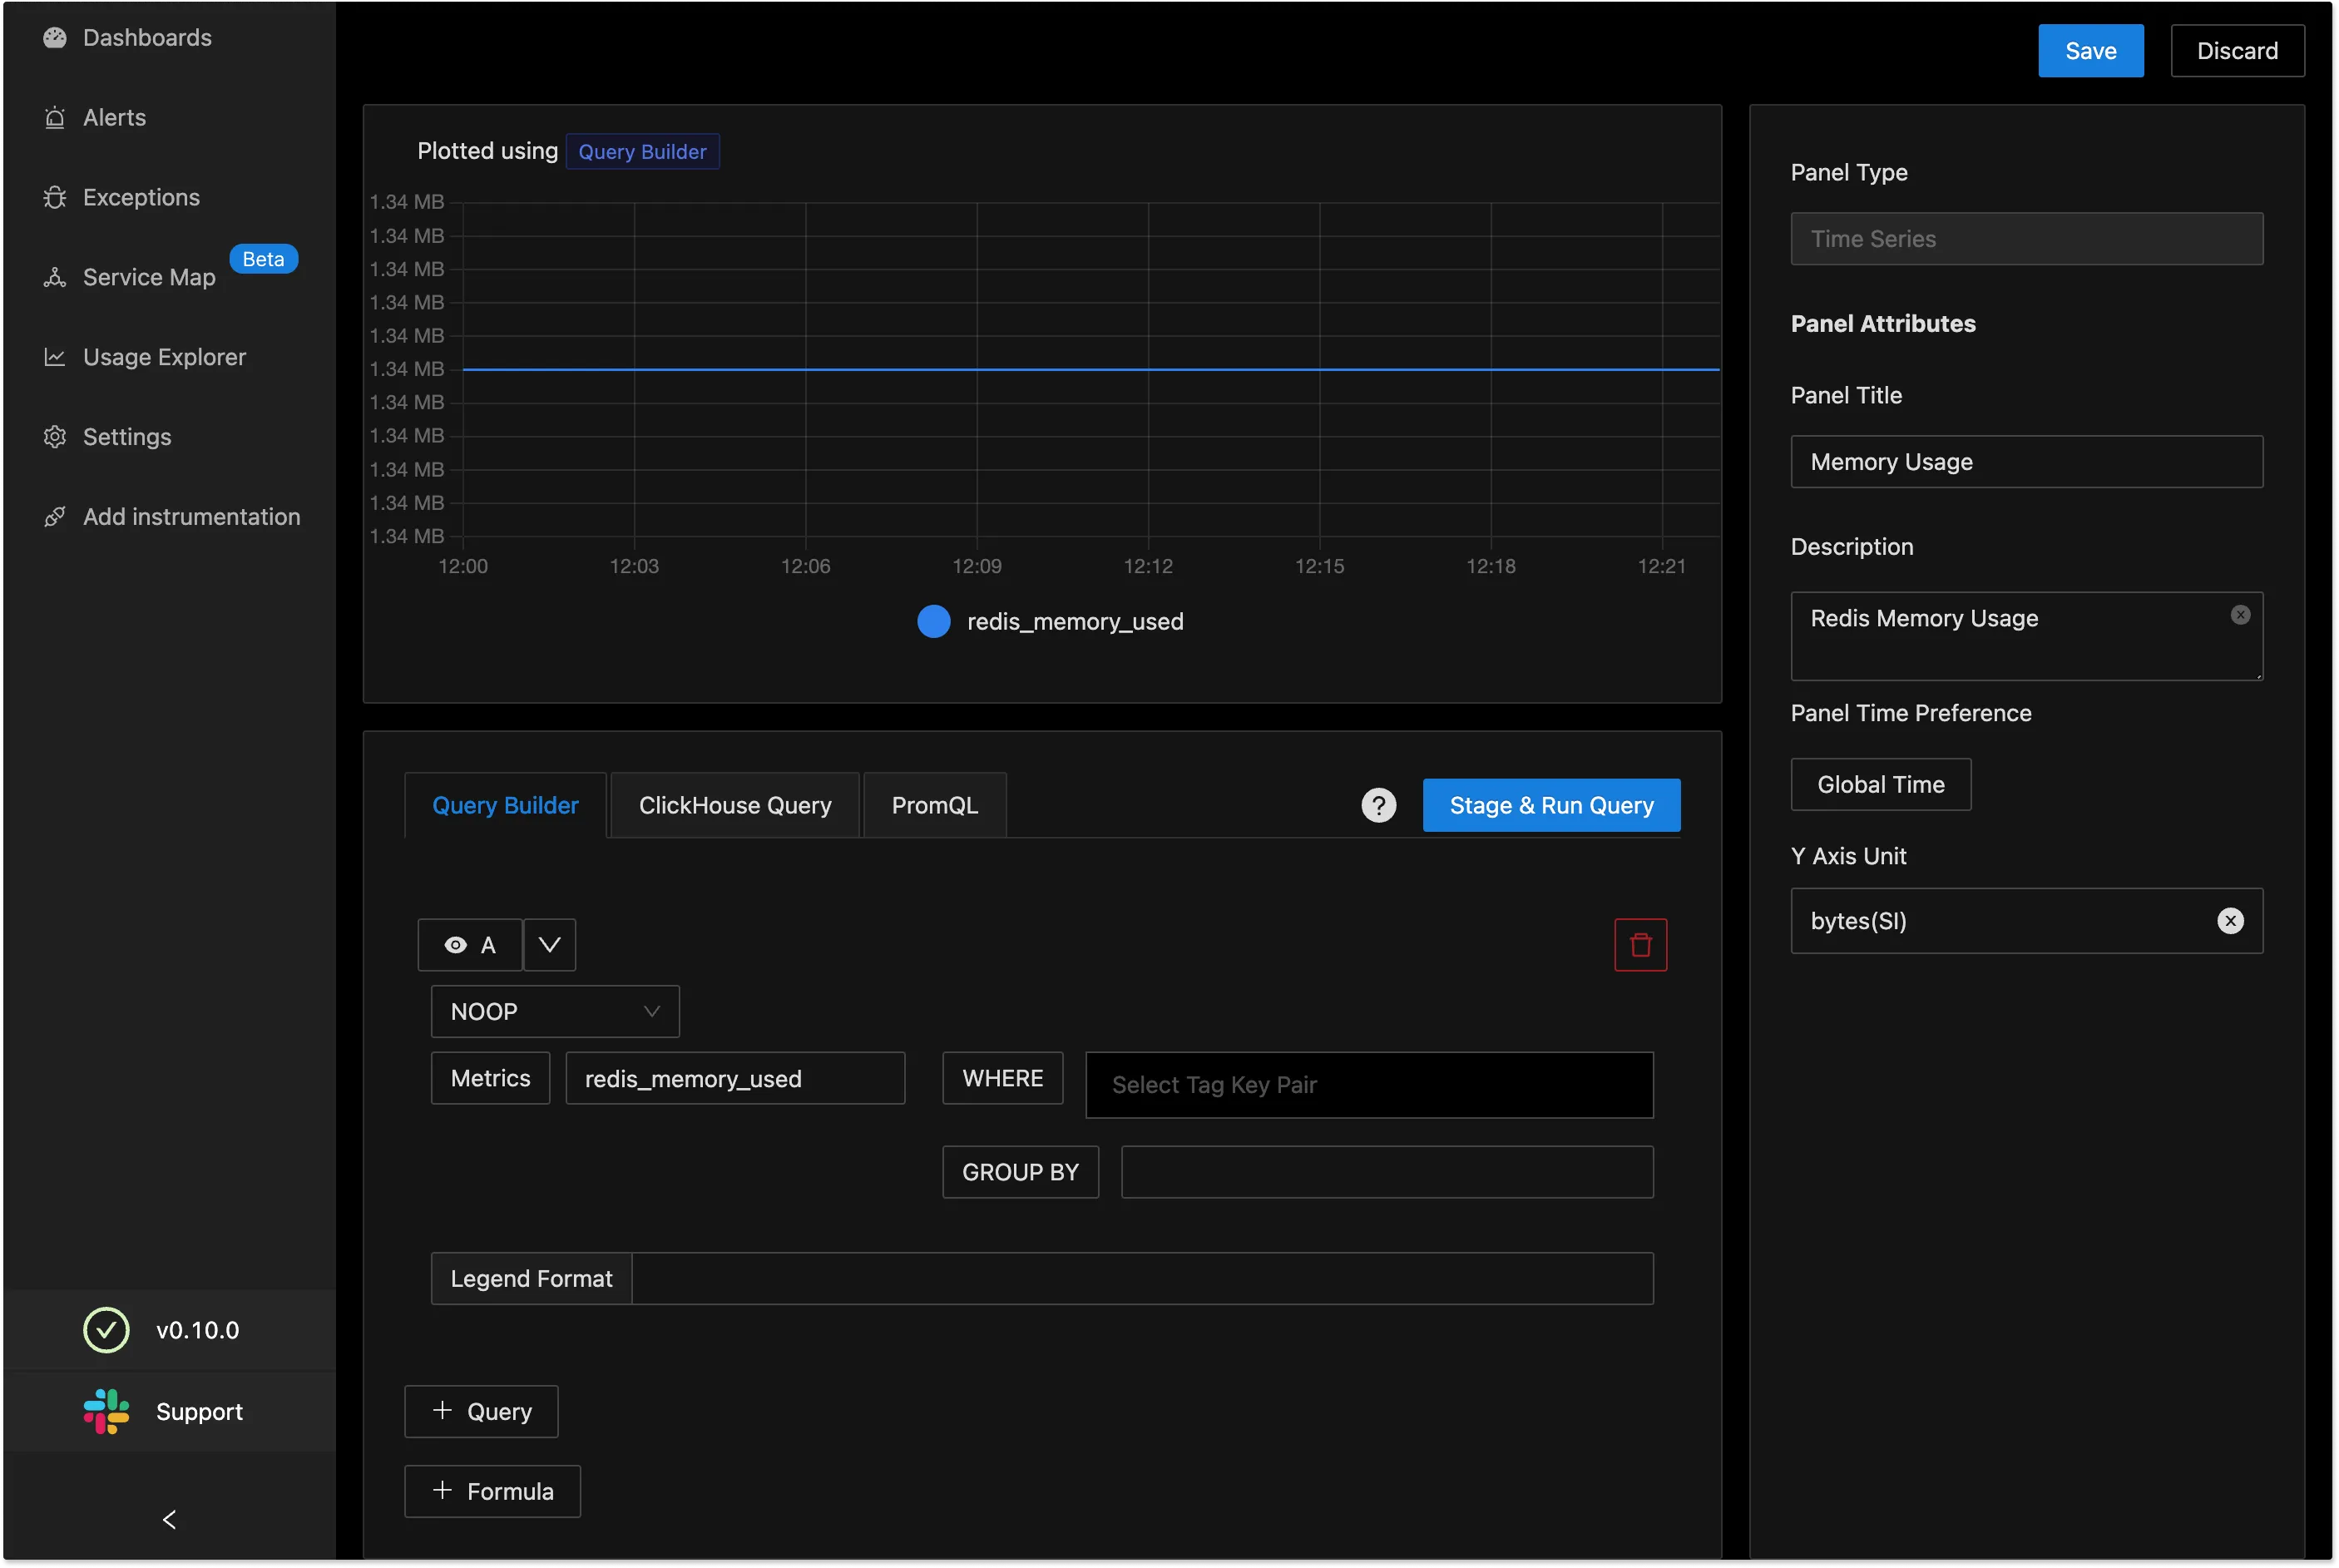
You can also use native ClickHouse queries or PromQL for creating the charts, but the query builder provides the easiest experience.
Once you are done building your charts, you can save the layout and start monitoring your Redis instance.
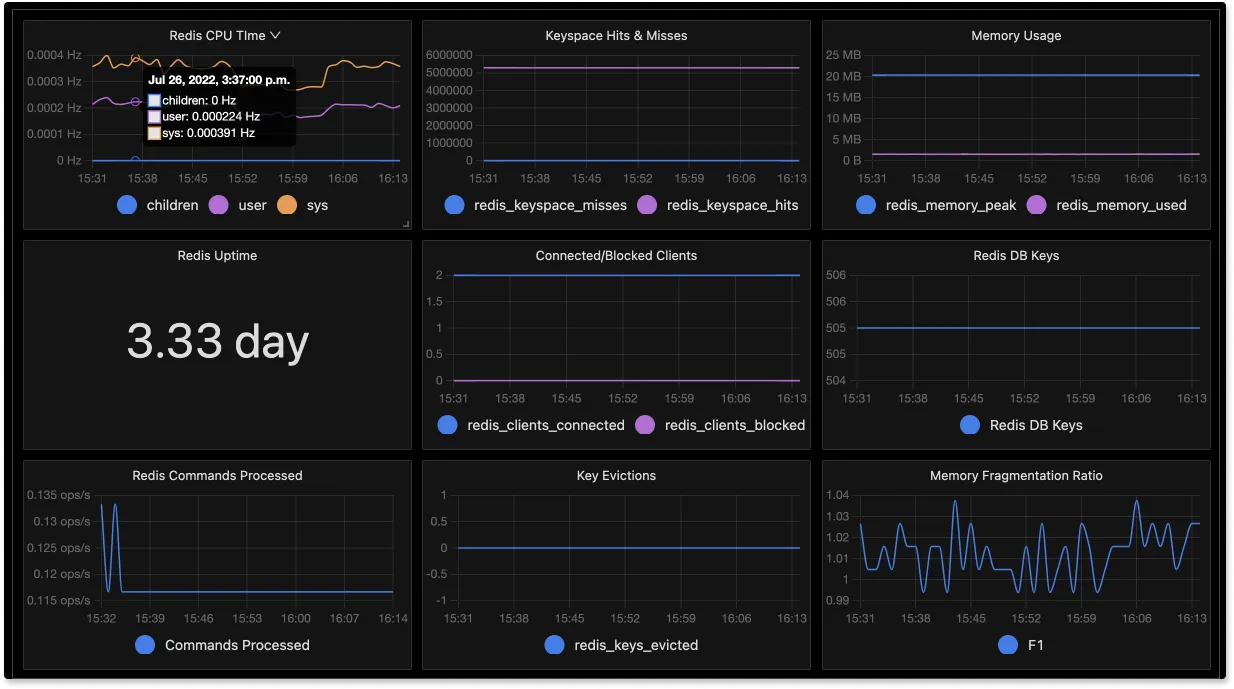
Full-stack APM experience for Redis
SigNoz is a full-stack open source APM that can monitor application statistics like latency, error rate, and requests per second with out-of-box charts and visualization.
If you’re using Redis in your technology stack, SigNoz APM can capture your application interaction with Redis. SigNoz also provides distributed tracing. With Flamegraphs and Gantt charts, you can visualize Redis calls as part of the entire transaction.
Final thoughts: end-to-end visibility of Redis
In this post, we learned how to set up Redis monitoring with SigNoz using OpenTelemetry collectors. Modern applications are mostly distributed systems. Performance monitoring of such systems requires complete visibility into each component and its interactions. A full stack APM like SigNoz can give you end-to-end visibility into your systems.
OpenTelemetry can instrument a wide variety of technologies. The data pipeline of OpenTelemetry Collector makes OpenTelemetry an ideal integration with other tools in the ecosystem. It also provides clients libraries for instrumenting application code in all the major programming languages.
OpenTelemetry and SigNoz make an ideal combo to monitor applications that use Redis in their stack. Visit our GitHub repo and get started with Redis monitoring:
If you want to know more about SigNoz, read this blog:
SigNoz - an open source alternative to DataDog
If you want to understand more about OpenTelemetry Collector, read this blog:


