Monitoring Redis for performance issues is critical. Redis is famous for its low-latency response while serving a large number of queries. There are certain key metrics that you can monitor to keep track of your Redis instance performance. In this guide, we will go through key Redis metrics that should be monitored and ways to collect these metrics with in-built Redis tools.
What is Redis?
Redis, which stands for Remote Dictionary Server, is an open-source in-memory database with a variety of use cases. It was developed by Salvatore Sanfilippo and was launched in 2009. It is famous as a key-value-oriented NoSQL database, and due to its in-memory database, it can serve data almost instantaneously.
Redis can be used for multiple use cases:
Caching
Caching is the most popular use case of the Redis database. Real-time applications that deal with vast amounts of data use Redis as low latency, highly available in-memory cache.Database
Redis became popular as a caching database but is now also used as a primary database. Modern applications are using Redis as a primary database to reduce the complexity of using it with another database like DynamoDB.Streaming Engine
The in-memory data store of Redis can power live streams of data.Message Broker
Message brokers have become a critical component of high-scale distributed systems. Redis implements a pub/sub messaging queue that supports pattern matching along with different types of data structures.
Database lies in the hot path for most of the applications, and any insight into its performance is valuable. It’s important to monitor Redis instances for performance and availability. In this post, we will go over some key Redis metrics that should be monitored.
Important Redis metrics to monitor
As Redis is an in-memory data store, it’s important to monitor its resource utilization. We also need to monitor its performance in terms of throughput or work done. Redis monitoring metrics can be divided into the following categories:
- Performance
- Memory
- Basic Activity
Here’s a list of Redis monitoring metrics at a glance:
| Performance | Memory | Activity |
|---|---|---|
| Latency | Memory Usage | connected_clients |
| CPU usage | Memory fragmentation ratio | blocked_clients |
| Hit Rate | Key evictions | connected_slaves |
| total_commands_processed | ||
| keyspace |
Depending on your use-case, you can expand on this list to include other metrics too.
Performance Metrics
Database performance issues can lead to a bad user experience. Redis performance can be measured through latency, CPU time, and Hit Rate, among other metrics. Let’s have a look at these metrics.
Latency
Latency is an important metric for measuring Redis performance. It measures the time taken for the Redis server to respond to client requests. Redis is popular as a low latency in-memory database and is often used for demanding use-cases.
Redis provides various ways to monitor latency metrics. A quick way to check latency is to use the following command:
redis-cli --latency -h 127.0.0.1 -p 6379
The above command continuously samples latency by issuing PING. It returns an output as shown below:

The different parameters in the output are described below:
5611 samples - Number of times the Redis CLI issued PING. This is the sample dataset. For example, the above command recorded 5611 requests and responses.
min - Represents the minimum delay between the time when CLI issued PING and the time when the reply was received. In this case, it is 0ms.
max - Represents the maximum delay between the time when CLI issued PING and the time when the reply was received. In this case, it is 95ms.
avg - Average response times for all sampled data. In this case, it is 0.52ms
There are other ways to monitor Redis latency. Redis 2.8.13 introduced Latency monitor. Using latency monitor, you can identify and troubleshoot possible latency problems.
For continuous monitoring of latency, you will need a dedicated monitoring system.
CPU Usage
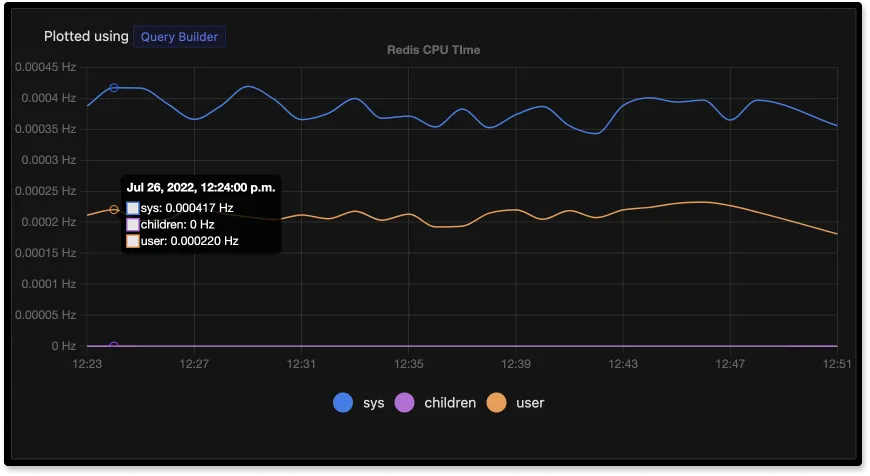
Redis CPU usage spikes can cause latency across your application. CPU usage is calculated using CPU time. CPU time is the amount of time a CPU spends processing a non-idle task. CPU time is usually expressed as a percentage of the total CPU’s capacity, which is known as CPU usage.
If you identify high CPU usage caused by Redis, you should investigate further. A good practice is to set TTL for keys that are supposed to live temporarily. High CPU usage can also be correlated to commands taking more time to execute. You can get a list of such commands by using the Redis slowlog.
Cache Hit Ratio
Redis cache hit ratio is one of the important performance metrics to monitor. It indicates the usage efficiency of the Redis instance. The ratio represents the percentage of successful hits (reads) out of all read operations. It is calculated as follows:
Cache Hit Ratio = (keyspace_hits)/(keyspace_hits + keyspace_misses)
The Redis INFO command gives you the total number of keyspace_hits and keyspace_misses.
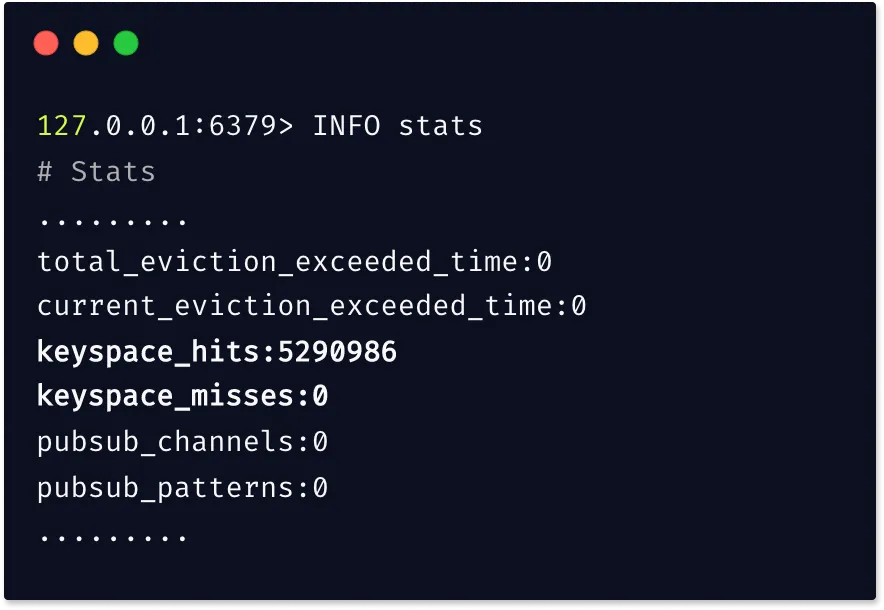
A cache hit ratio above 0.8 is good to have. If the ratio is below 0.8, then it means a significant amount of keys have expired or are evicted. It can also indicate insufficient memory allocation since most keys are evicted. It is usually a good practice to use a dedicated monitoring tool to monitor Redis cache hit ratio.
Memory Metrics
Memory is a critical resource for Redis. As an in-memory database, the performance of Redis instances depends on sufficient memory resources. Let’s have a look at important memory metrics for Redis.
Memory Usage
If the memory usage of the Redis instance exceeds the total available memory, it leads to memory swapping. Memory swapping involves reclaiming memory space by moving unused memory contents to the disk. Writing or reading from disk is much slower and defeats the purpose of using Redis. Tracking memory usage can ensure that Redis instances use less memory than total available memory.
You can also configure the maximum memory for Redis using the maxmemory directive. The settings can be configured using the redis.config file or later by using the CONFIG SET command at runtime. When the memory used by Redis reaches the specified amount, you can use key eviction policies to free up some space.
Memory Fragmentation Ratio
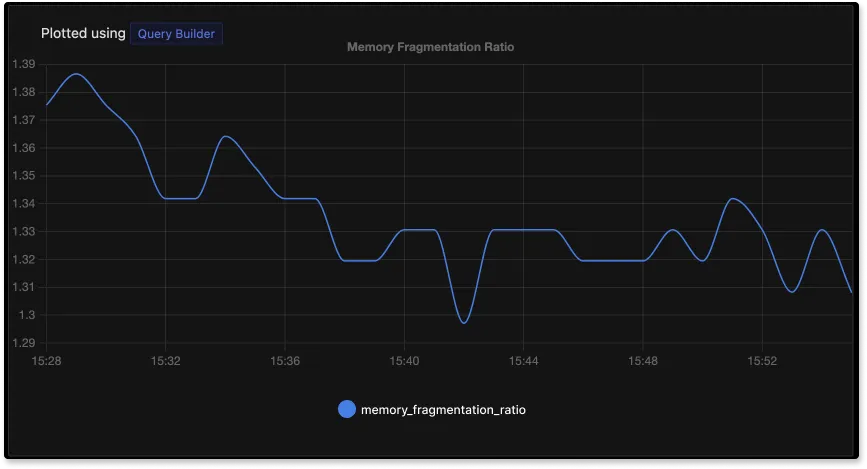
Memory fragmentation issues can lead to reduced performance and increased latency. Memory fragmentation ratio is defined as the ratio of memory allocated by the operating system to used memory by Redis. Let’s break it down further.
The operating system allocates physical memory to each process. Ideally, Redis needs contiguous sections of memory to store its data. But if the operating system is unable to find a contiguous section, it will allocate fragmented memory sections to store Redis data which leads to overhead in memory usage.
Memory fragmentation in Redis is calculated as the ratio of used_memory_rss to used_memory.
used_memory_rss - It is defined as the number of bytes allocated by the operating system.
used_memory - It is defined as the number of bytes allocated by Redis.
A memory fragmentation ratio greater than and closer to 1 is considered healthy. If it is lower than 1, it means you need to allocate more memory to Redis immediately, or it will start to swap memory. Memory fragmentation ratio greater than 1.5 indicates excessive memory fragmentation. You will have to restart your Redis server to fix excessive memory fragmentation.
A snapshot of used_memory and used_memory_rss using the info memory command:
127.0.0.1:6379> info memory
# Memory
used_memory:1463344
used_memory_human:1.40M
used_memory_rss:2211840
used_memory_rss_human:2.11M
In the above snapshot, the memory fragmentation ratio is above 1.5 indicating excessive memory fragmentation. You can monitor memory fragmentation ratio with Redis dashboards in SigNoz.
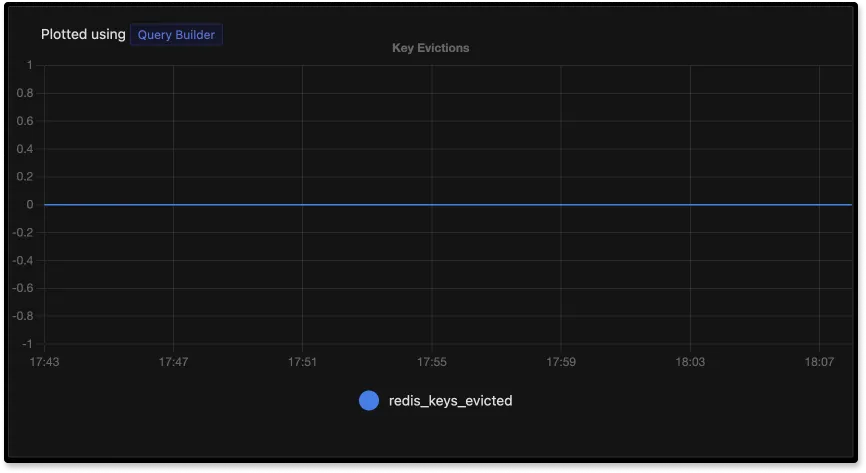
Key Eviction
When Redis hits the max_memory_limit, you need to evict keys based on an eviction policy. It’s a usual process of automatically evicting old data as new data gets added. Users can use the maxmemory directive to limit Redis memory usage to a fixed amount. Above this fixed amount, old keys start getting evicted.
Redis runs operations as a single-threaded process. A higher key eviction rate can lead to lower response times; hence, it is important to monitor the key eviction rate.
Basic Activity Metrics
Apart from performance and memory metrics, it is useful to know some basic activity metrics of the Redis instance. Below is the list of basic activity metrics that you should monitor, along with their definition:
connected_clients
Number of client connections (excluding connections from replicas).
blocked_clients
Number of clients pending on a blocking call.
connected_slaves
Number of connected replicas.
total_commands_processed
Total number of commands processed by the Redis instance.
keyspace
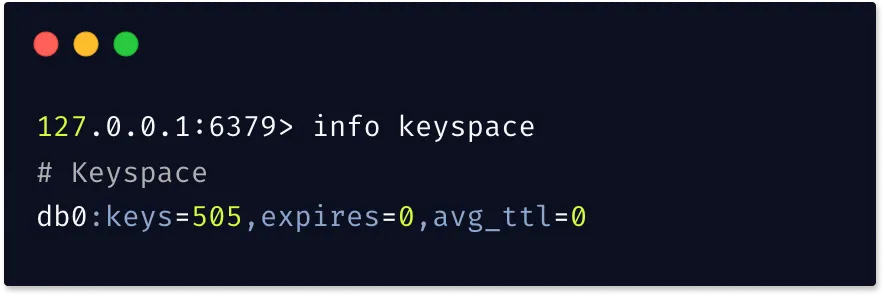
keyspace is one of the sections in the Redis INFO command. It’s important to know the number of keys in the database. The keyspace parameter provides statistics about the number of keys, and the number of keys with an expiration.
How to collect Redis metrics?
You can access statistics about the Redis server using the Redis command-line interface, redis-cli. The INFO command returns a lot of useful information about the health and performance of running Redis instances. You can also use the metrics provided by the INFO command to calculate important Redis metrics.
Redis INFO command provides you with information on the following ten sections:
- Server
- Clients
- Memory
- Persistence
- stats
- replication
- CPU
- commandstats
- cluster
- keyspace
If Redis is running as an instance on your machine, you can access the following stats easily. For example, below is a snapshot of using the INFO command with the server parameter:
~ redis-cli
127.0.0.1:6379> info server
# Server
redis_version:7.0.3
redis_git_sha1:00000000
redis_git_dirty:0
redis_build_id:b50a789ee26ce984
redis_mode:standalone
os:Darwin 20.6.0 arm64
arch_bits:64
monotonic_clock:POSIX clock_gettime
multiplexing_api:kqueue
atomicvar_api:c11-builtin
gcc_version:4.2.1
process_id:466
process_supervised:no
run_id:05cc64e171ca4cf1febf78e6048c335454ba6e62
tcp_port:6379
server_time_usec:1658387280157495
uptime_in_seconds:90282
uptime_in_days:1
hz:10
configured_hz:10
lru_clock:14220112
executable:/opt/homebrew/opt/redis/bin/redis-server
config_file:/opt/homebrew/etc/redis.conf
io_threads_active:0
127.0.0.1:6379>
Redis Latency Monitor
Redis 2.8.13 and above comes with Redis Latency Monitor. You can use it to check and troubleshoot possible latency problems. The first step toward enabling the Latency monitor is to set a latency threshold. The configuration takes a threshold value in milliseconds, and logs all events that block the server for more than 100 milliseconds.
You can enable the latency monitor at runtime in a production server with the following command:
CONFIG SET latency-monitor-threshold 100
Once the configuration is done, you can interact with the Latency monitor using a set of Latency commands:
LATENCY LATEST- returns the latest latency samples for all events.LATENCY HISTORY- returns latency time series for a given event.LATENCY RESET- resets latency time series data for one or more events.LATENCY GRAPH- renders an ASCII-art graph of an event's latency samples.LATENCY DOCTOR- replies with a human-readable latency analysis report.
Redis slowlog
Redis slowlog can be used to trace and debug Redis databases. You can use this command from the redis-cli. It helps you to identify queries that took more than a specified execution time. Here’s how to use it:
127.0.0.1:6379> slowlog help
 1) SLOWLOG <subcommand> [<arg> [value] [opt] ...]. Subcommands are:
 2) GET [<count>]
 3)     Return top <count> entries from the slowlog (default: 10, -1 mean all).
 4)     Entries are made of:
 5)     id, timestamp, time in microseconds, arguments array, client IP and port,
 6)     client name
 7) LEN
 8)     Return the length of the slowlog.
 9) RESET
10)     Reset the slowlog.
11) HELP
12)     Prints this help.
127.0.0.1:6379>
Final Thoughts
In this post, we went over some key Redis monitoring metrics. Redis provides a number of in-built tools to access performance snapshots. It is helpful in case of quick check-in or debugging. But you need a dedicated monitoring system to keep track of how your Redis instances are performing over time.
A monitoring tool that allows you to store, query, and visualize Redis monitoring metrics can help you debug performance issues quickly. For modern applications based on a distributed architecture, it is important to correlate your Redis metrics with the rest of the application infrastructure.
You can set up Redis monitoring using open source APM - SigNoz. SigNoz is built to support OpenTelemetry, which is becoming the world standard for instrumenting cloud-native applications.
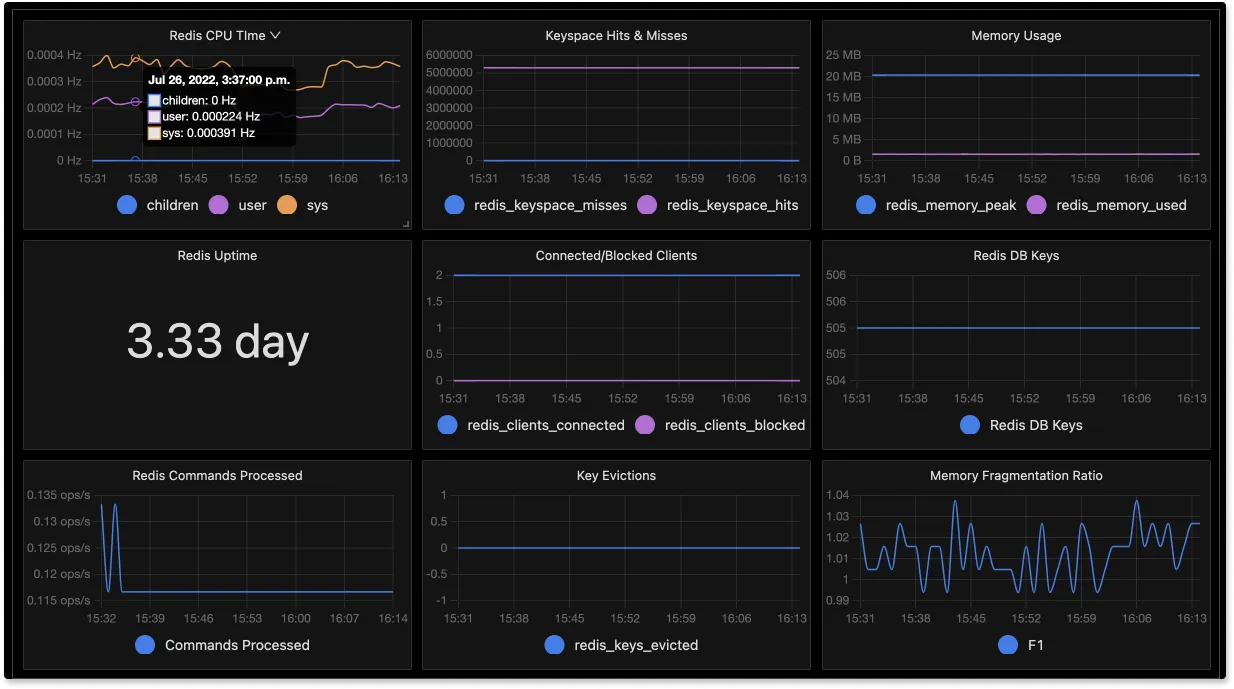
In the following post, we guide you on how to setup Redis monitoring using OpenTelemetry and Signoz:
