OpenTelemetry can auto-instrument your Java Spring Boot application to capture telemetry data from a number of popular libraries and frameworks that your application might be using. Let's learn how it works.
OpenTelemetry is a vendor-agnostic instrumentation library. In this article, let's explore how you can auto-instrument your Java Spring Boot application with OpenTelemetry and get the data reported through SigNoz - an open-source APM and observability tool.
But before that, let's have a brief overview of OpenTelemetry.
What is OpenTelemetry?
OpenTelemetry is a set of API, SDKs, libraries, and integrations aiming to standardize the generation, collection, and management of telemetry data(logs, metrics, and traces). OpenTelemetry is a Cloud Native Computing Foundation project created after the merger of OpenCensus(from Google) and OpenTracing(From Uber).The data you collect with OpenTelemetry is vendor-agnostic and can be exported in many formats. Telemetry data has become critical to observe the state of distributed systems. With microservices and polyglot architectures, there was a need to have a global standard. OpenTelemetry aims to fill that space and is doing a great job at it thus far.
OpenTelemetry provides client libraries and agents for most of the popular programming languages. There are two types of implementation of OpenTelemetry libraries:
- Auto-instrumentation
OpenTelmetry can collect data for many popular frameworks and libraries automatically. You don’t have to make any code changes. - Manual instrumentation
If you want more application-specific data, OpenTelemetry SDK provides you with the capabilities to capture that data using OpenTelemetry APIs and SDKs.
For Spring Boot applications, we can use the OpenTelemetry Java Jar agent. We just need to download the latest version of the Java Jar agent and run the application with it.
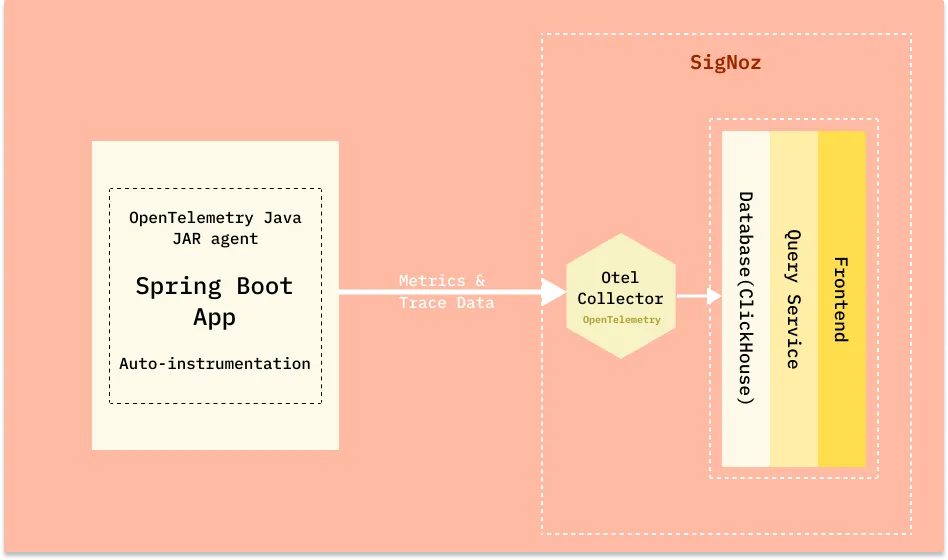
OpenTelemetry does not provide storage and visualization layer for the collected data. The advantage of using OpenTelemetry is that it can export the collected data in many different formats. So you're free to choose your telemetry backend. Natively, OpenTelemetry supports a wire protocol known as OTLP. This protocol sends the data to OpenTelemetry Collector as shown in the diagram above.
In this tutorial, we will use SigNoz, an open-source APM as the backend and visualization layer.
Steps to get started with OpenTelemetry for Spring Boot application:
- Installing SigNoz
- Installing sample Spring Boot app
- Auto instrumentation with OpenTelemetry and sending data to SigNoz
Installing SigNoz
SigNoz can be installed on macOS or Linux computers in just three steps by using a simple install script.
The install script automatically installs Docker Engine on Linux. However, on macOS, you must manually install Docker Engine before running the install script.
git clone -b main https://github.com/SigNoz/signoz.git
cd signoz/deploy/
./install.sh
You can visit our documentation for instructions on how to install SigNoz using Docker Swarm and Helm Charts.
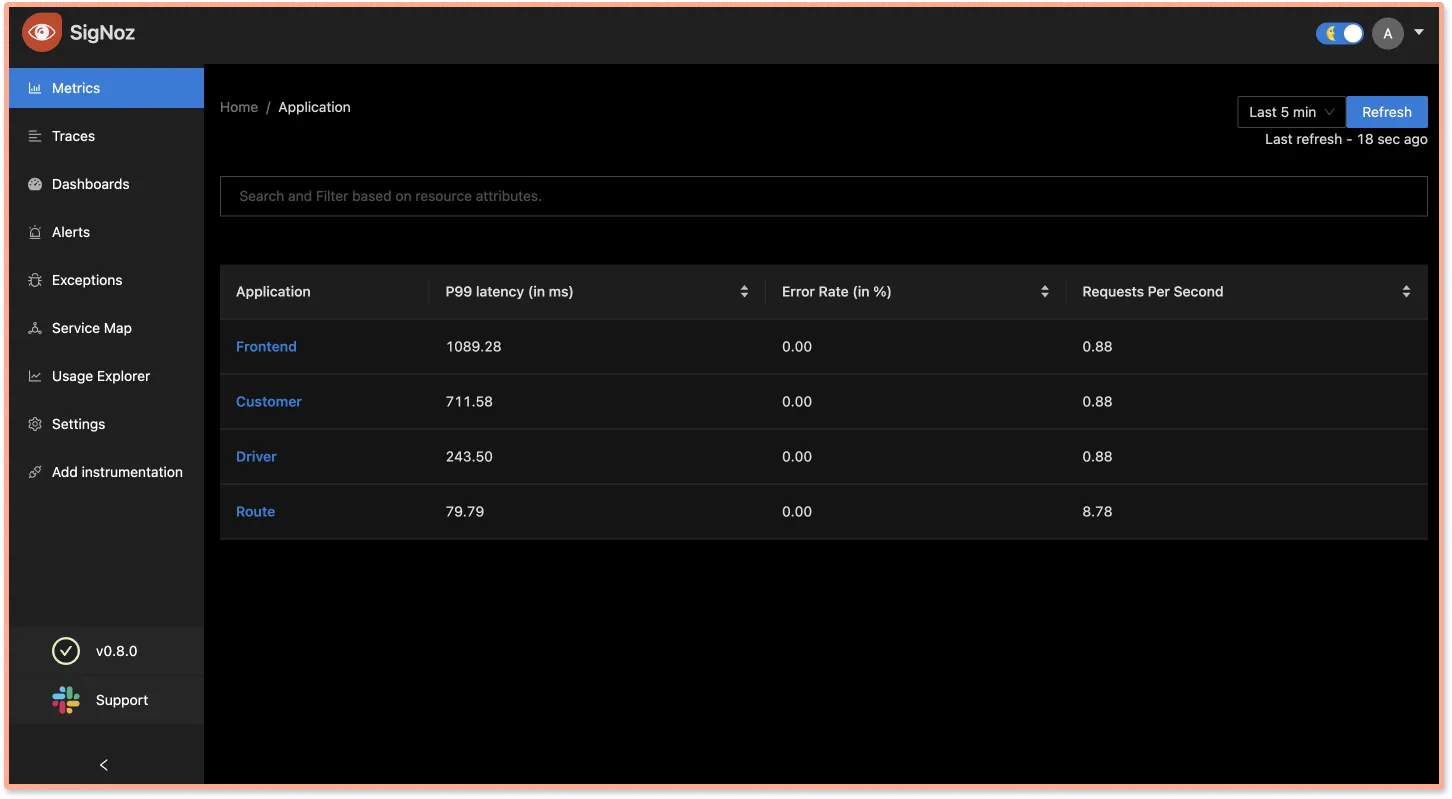
When you are done installing SigNoz, you can access the UI at http://localhost:3301
Installing sample Spring Boot app
If you don't have Java installed, first install it from the official website.
For this tutorial, we will use a sample Spring Boot application built using Maven. You can find the code for the application at its GitHub repo.
Steps to get the app set up and running:
Git clone the repository and go to the root folder
git clone https://github.com/SigNoz/spring-petclinic.git
cd spring-petclinic
Run the application using the following commands.
./mvnw package
java -jar target/*.jarYou can now access the application UI here: http://localhost:8090/
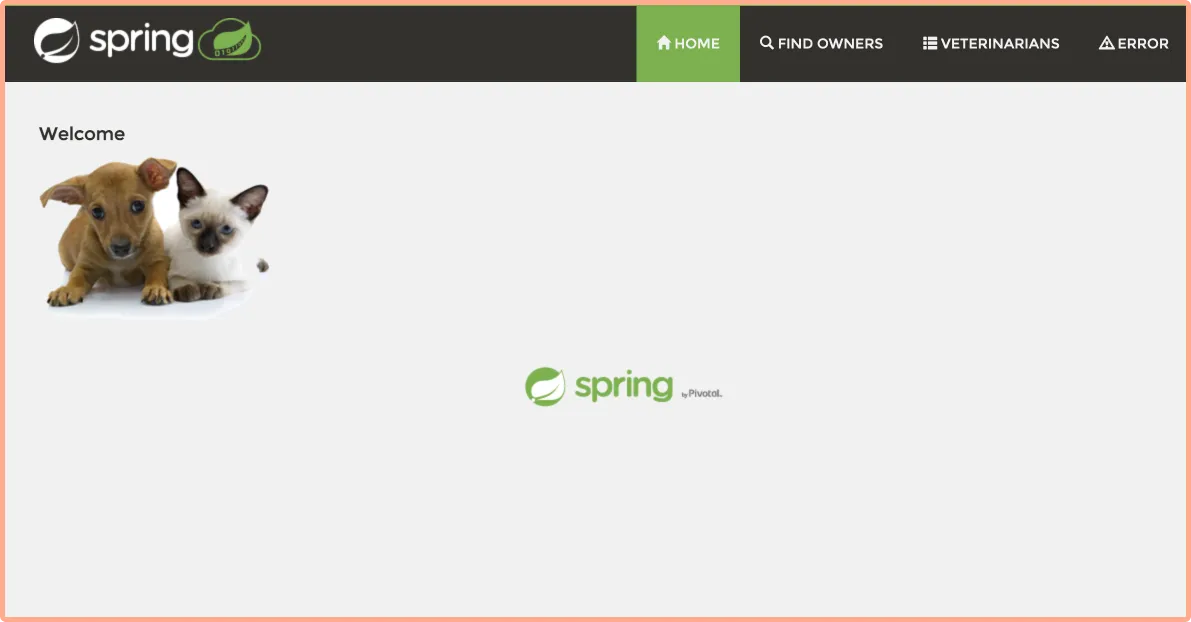
Once you ensure that your application runs fine, stop it with ctrl + c on mac, as we will be launching the application with the Java agent downloaded from OpenTelemetry.
Auto instrumentation with OpenTelemetry and sending data to SigNoz
For instrumenting Java applications, OpenTelemetry has a very handy Java JAR agent that can be attached to any Java 8+ application. The JAR agent can detect a number of popular libraries and frameworks and instrument it right out of the box. You don't need to add any code for that.
Download the latest Java JAR agent. You will need the path of this file, so note it down somewhere. You can also use the terminal to get this file using the following command:
wget https://github.com/open-telemetry/opentelemetry-java-instrumentation/releases/latest/download/opentelemetry-javaagent.jarNow you need to enable the instrumentation agent as well as run your sample application. You can do so by the following command:
OTEL_EXPORTER_OTLP_ENDPOINT="http://<IP of SigNoz>:4317" OTEL_RESOURCE_ATTRIBUTES=service.name=javaApp java -javaagent:/path/opentelemetry-javaagent.jar -jar target/*.jar
As you are running this on your local host, you need to replace `IP of SigNoz` with `localhost`. You will also need to update the path for your downloaded Java JAR agent. You will replace following two things:IP of SigNoz:localhost/path/to:Users/cruxaki/Downloads(For my local)
Your final command will look like this:
OTEL_EXPORTER_OTLP_ENDPOINT="http://localhost:4317" OTEL_RESOURCE_ATTRIBUTES=service.name=javaApp java -javaagent:/Users/cruxaki/Downloads/opentelemetry-javaagent.jar -jar target/*.jar
Note the path is updated for my local environment. If you are using a virtual machine, you need to update the IP accordingly. You also need to have the Java JAR agent on the same machine.You can also use
-Doption to install the java agent.java -javaagent:/path/opentelemetry-javaagent.jar \
-Dotel.exporter.otlp.endpoint=http://<IP of SigNoz>:4317 \
-Dotel.resource.attributes=service.name=<service_name> \
-jar target/*.jar
Check out the Spring Pet Clinic app at: http://localhost:8090/ and play around with it to generate some load. You can try refreshing the endpoint multiple times to generate load. It might take 1-2 minutes before it starts showing up in the SigNoz dashboard.
Below you can find your javaApp in the list of applications being monitored.
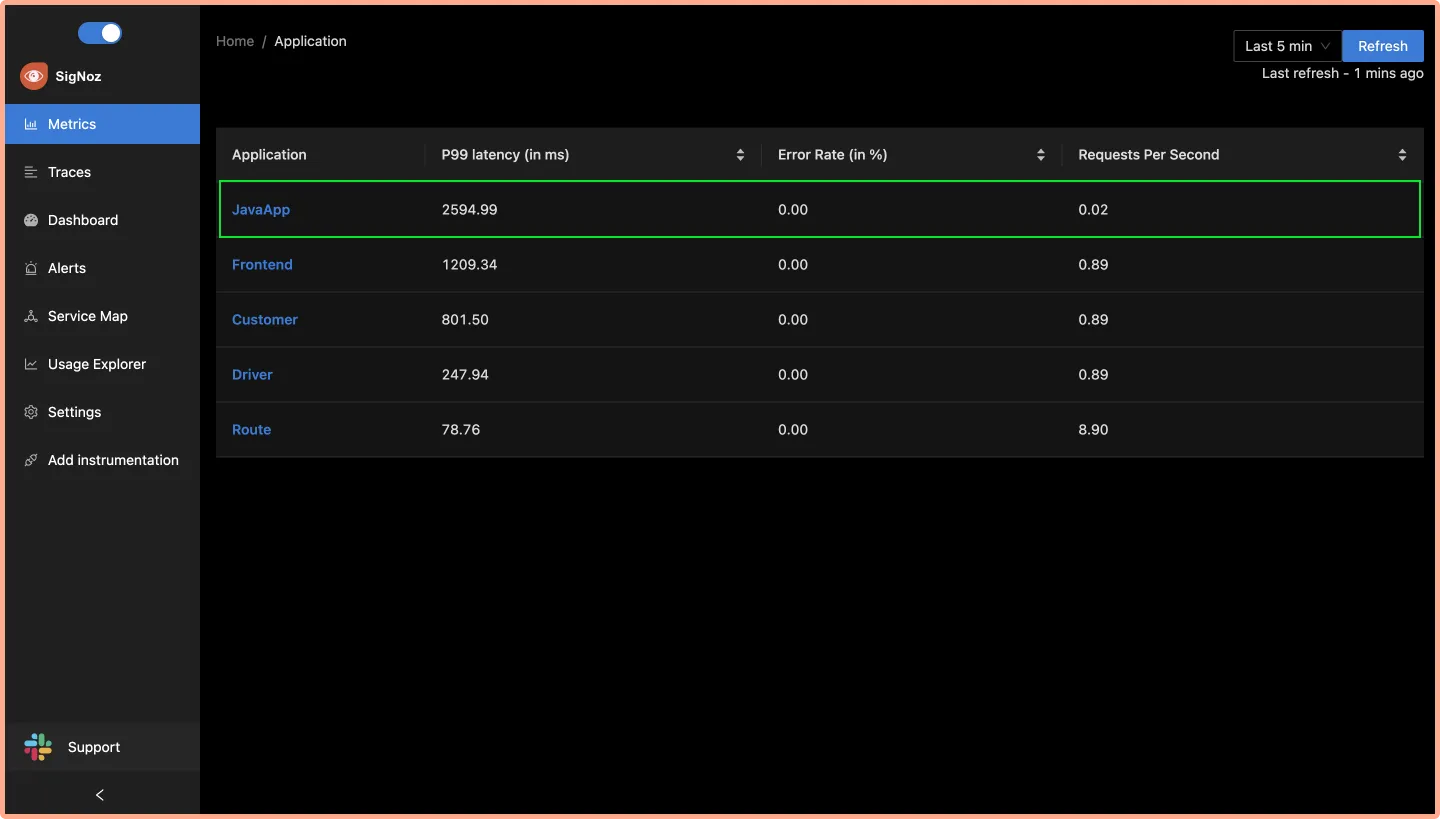
Metrics and Traces of the Spring Boot application
SigNoz makes it easy to visualize metrics and traces captured through OpenTelemetry instrumentation.
SigNoz comes with out of box RED metrics charts and visualization. RED metrics stands for:
- Rate of requests
- Error rate of requests
- Duration taken by requests
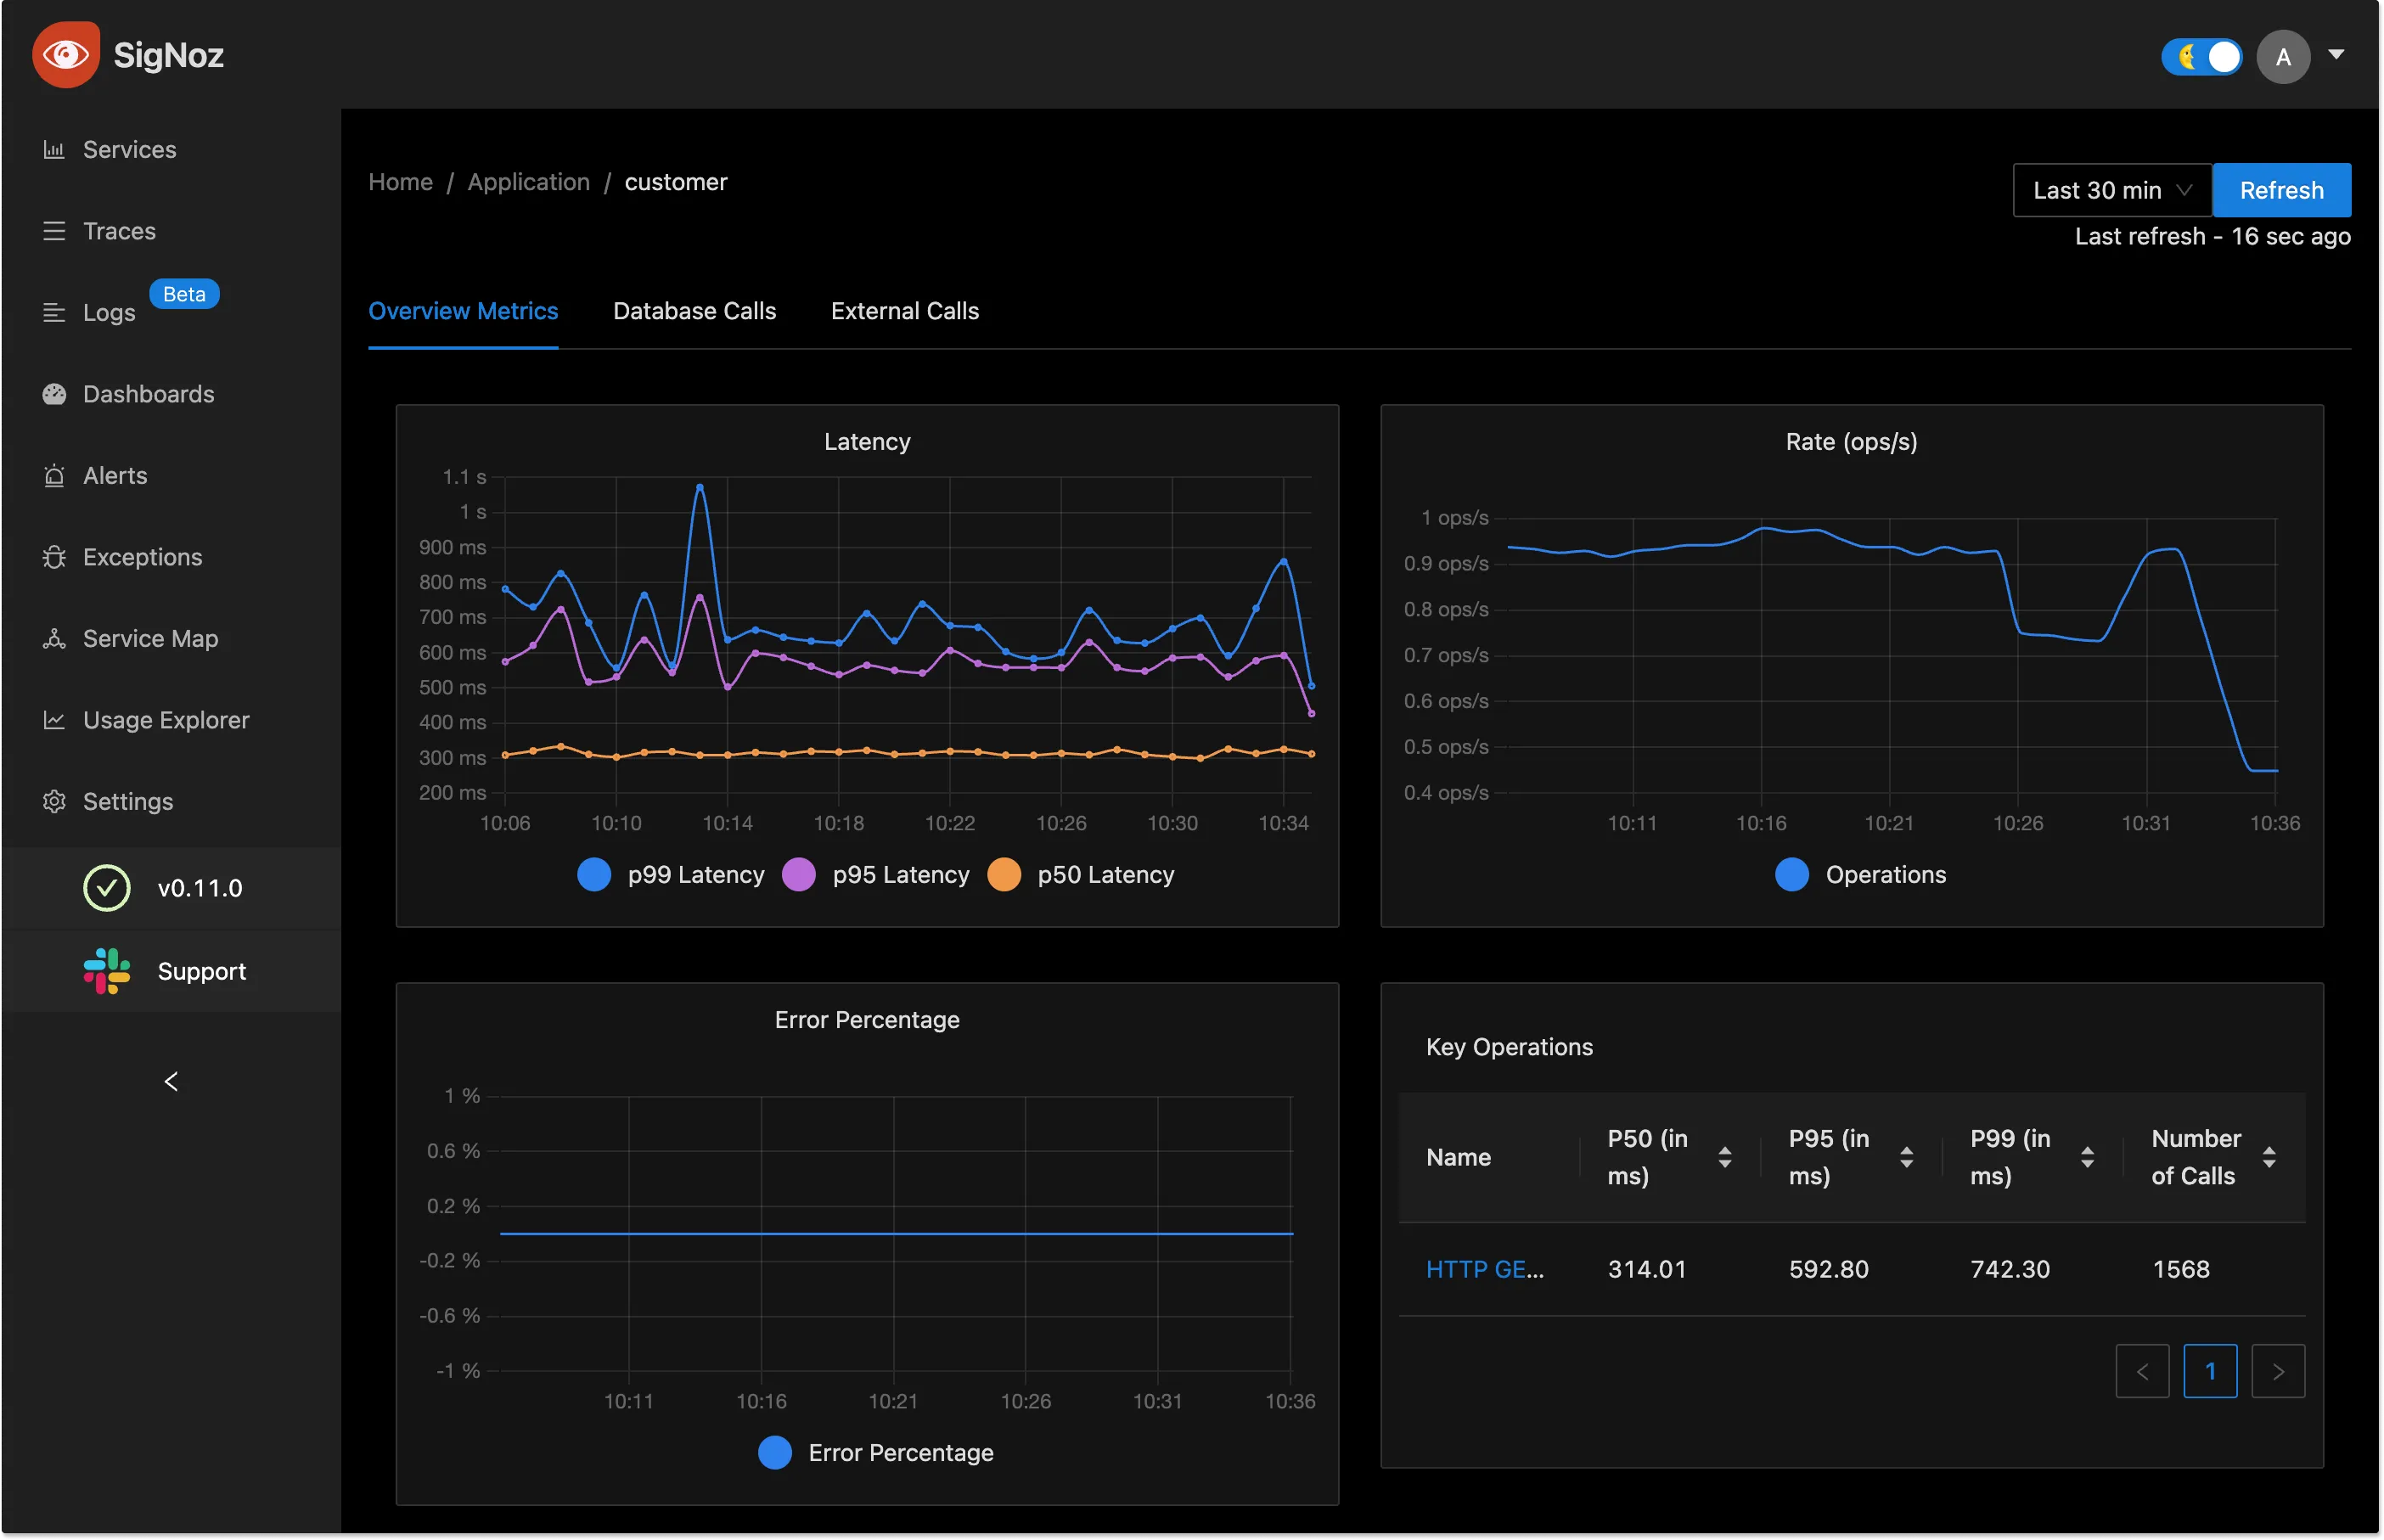
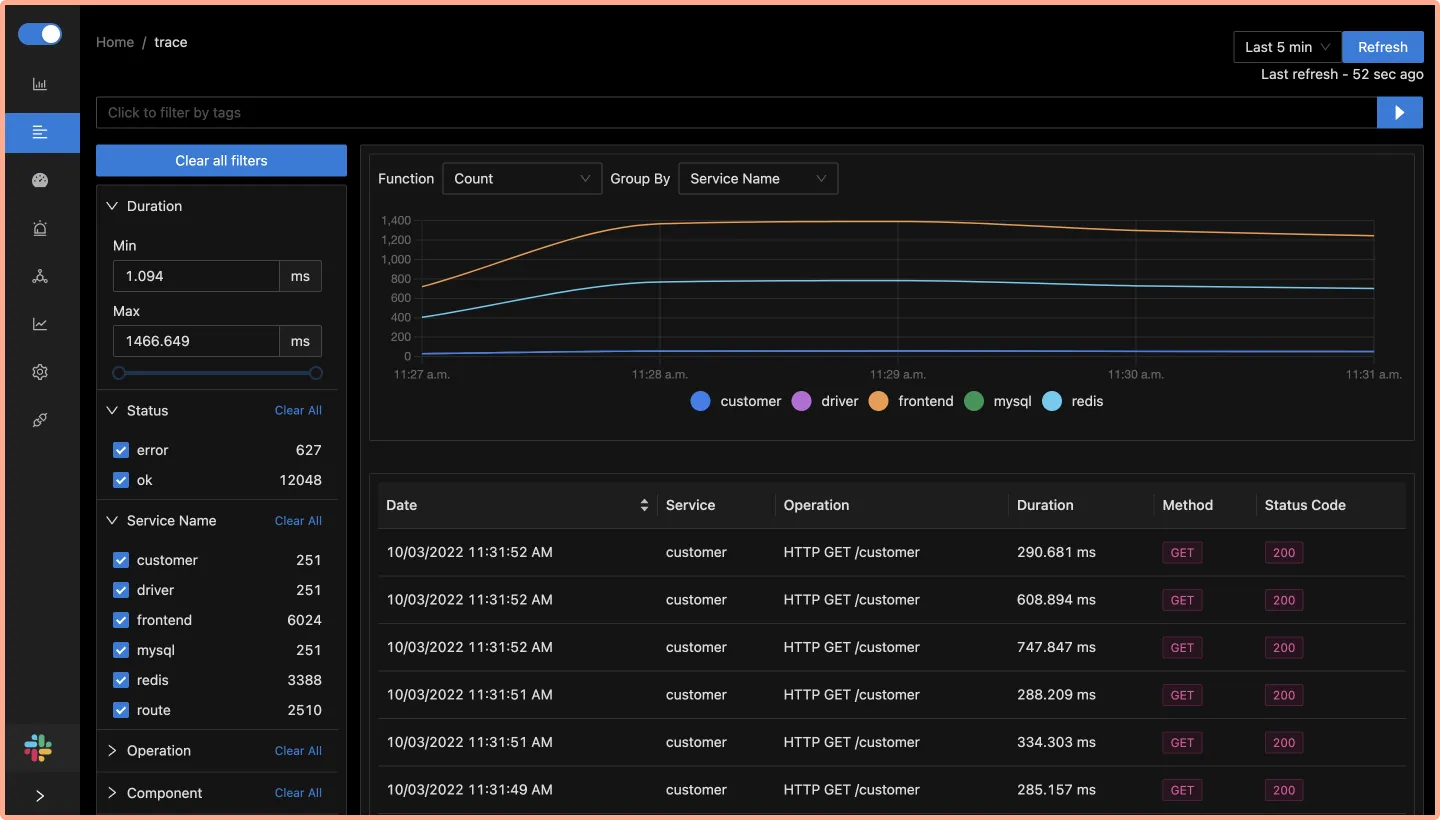
You can then choose a particular timestamp where latency is high to drill down to traces around that timestamp.
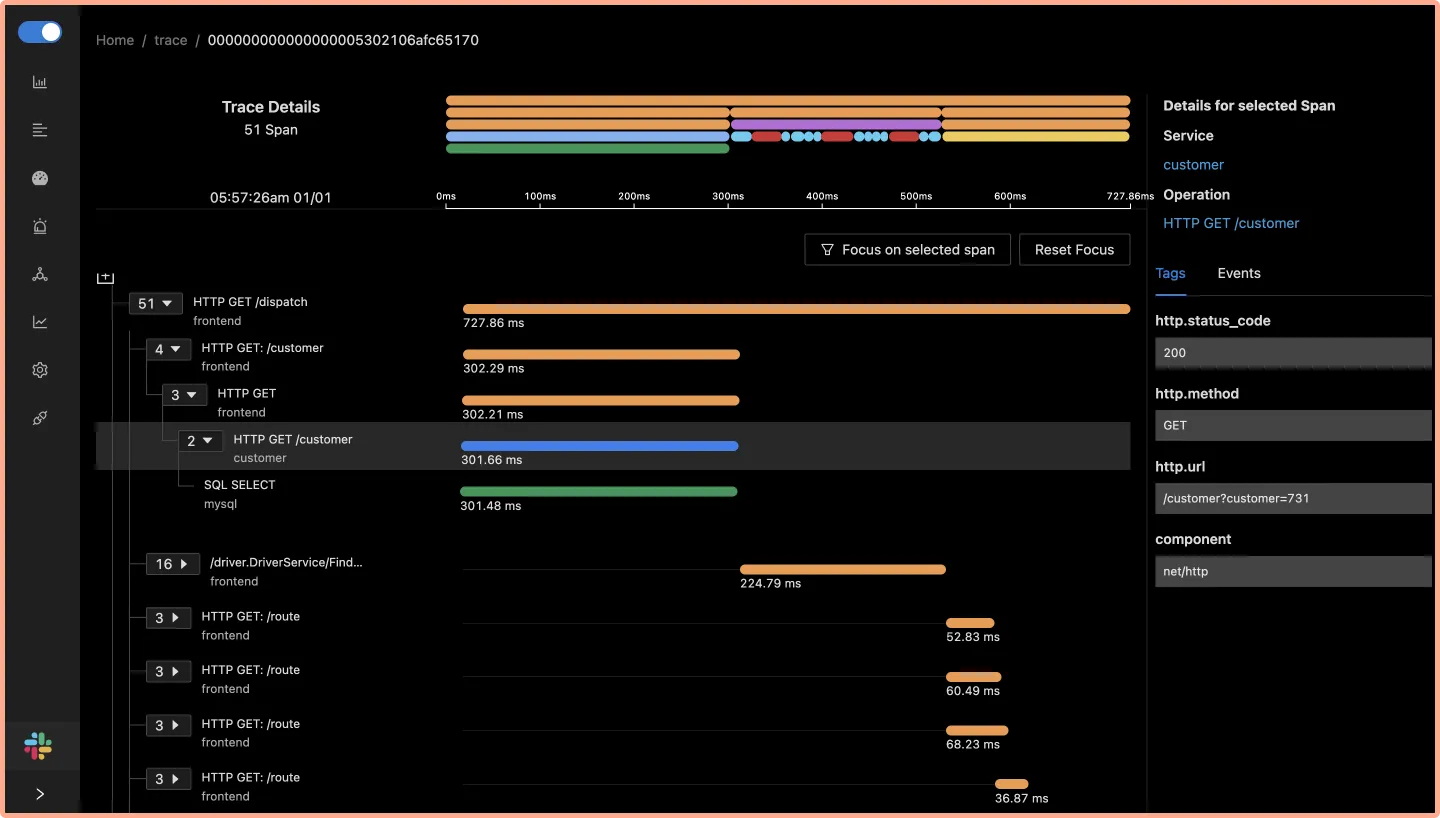
You can use flamegraphs to exactly identify the issue causing the latency.
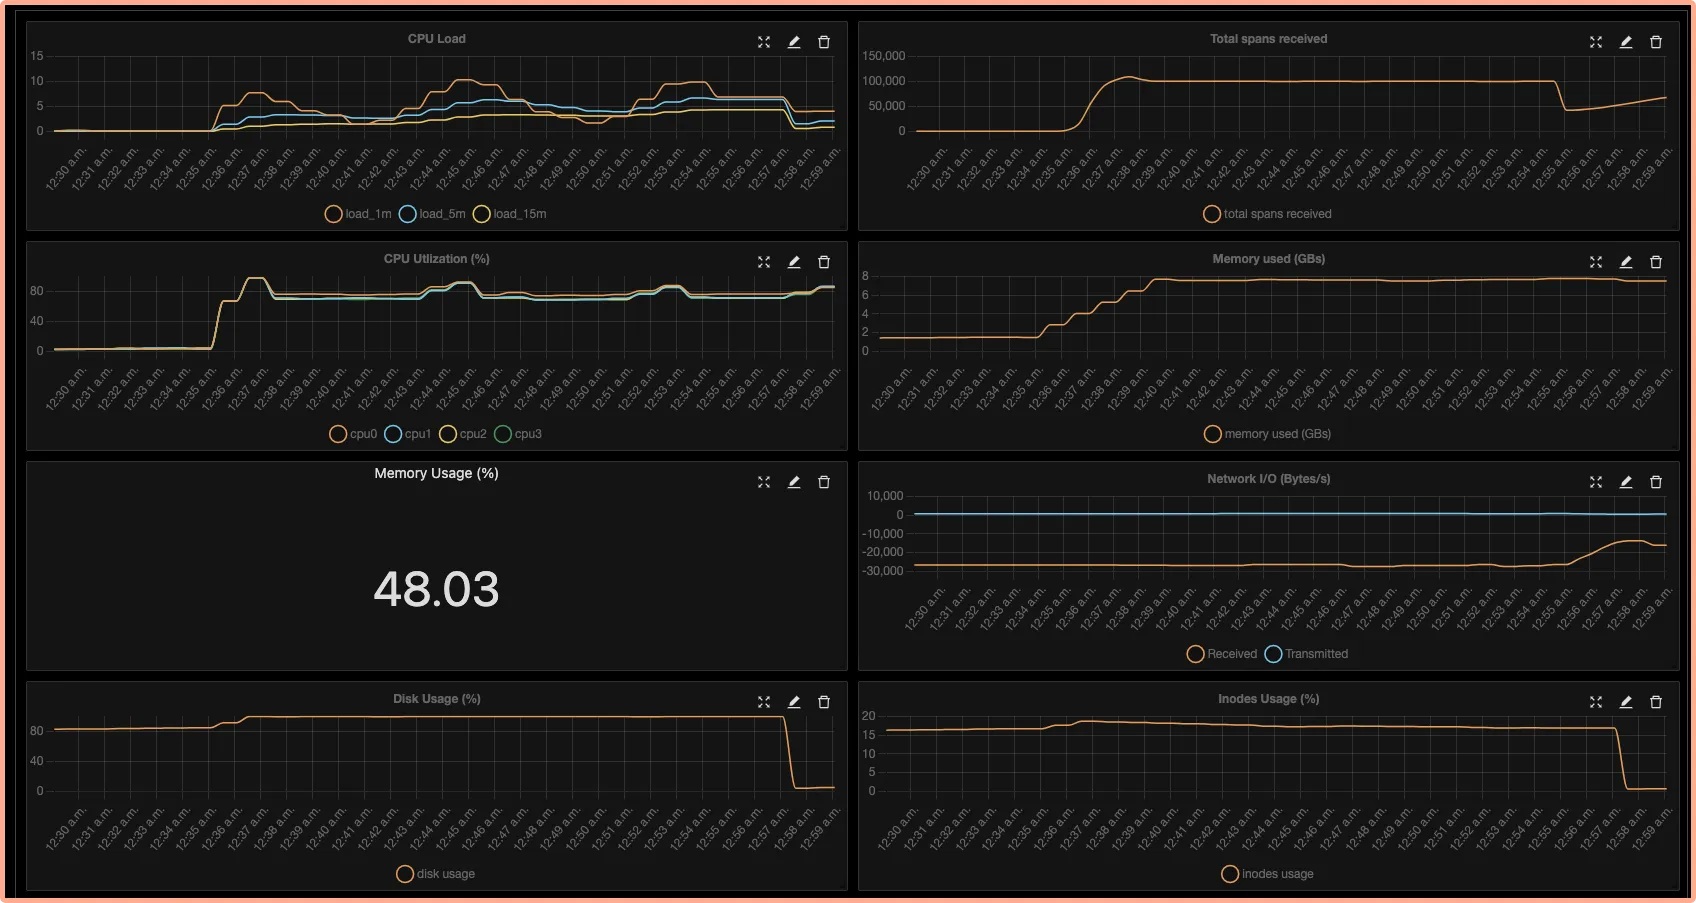
You can also build custom metrics dashboard for your infrastructure.
Conclusion
OpenTelemetry makes it very convenient to instrument your Spring Boot application. You can then use an open-source APM tool like SigNoz to analyze the performance of your app. As SigNoz offers a full-stack observability tool, you don't have to use multiple tools for your monitoring needs.
You can try out SigNoz by visiting its GitHub repo 👇
If you are someone who understands more from video, then you can watch the tutorial on how to use OpenTelemetry for Spring Boot application here 👇

If you have any questions or need any help in setting things up, join our slack community and ping us in #support channel.
If your Spring Boot application is based on microservices architecture, check out this blog 👇


