Ruby on Rails is a popular MVC framework for creating web applications. It is necessary to monitor your Ruby applications for performance issues. In today’s cloud-native and microservices-based architecture, it is difficult for engineering teams to troubleshoot performance issues.

Tracing your application can give the much needed context required to troubleshoot performance issues. OpenTelemetry is an open-source project that can help you to set up an observability framework for your cloud-native applications.
What is Distributed Tracing?
Distributed tracing is a method to track user requests in their entirety as it travels across components of a distributed system.
A single user request might go through hundreds of services before serving the user what they need. Using OpenTelemetry client libraries, you can collect tracing data from your Ruby applications to monitor how user requests are performing across services.
The tracing data can then be visualized using an observability tool like SigNoz. Before we demonstrate how to implement the OpenTelemetry client libraries for a Ruby application, let’s have a brief overview of OpenTelmetry.
What is OpenTelemetry?
OpenTelemetry is an open-source vendor-agnostic set of tools, APIs, and SDKs used to instrument applications to create and manage telemetry data(logs, metrics, and traces). It aims to make telemetry data(logs, metrics, and traces) a built-in feature of cloud-native software applications.The telemetry data is then sent to an observability tool for storage and visualization.
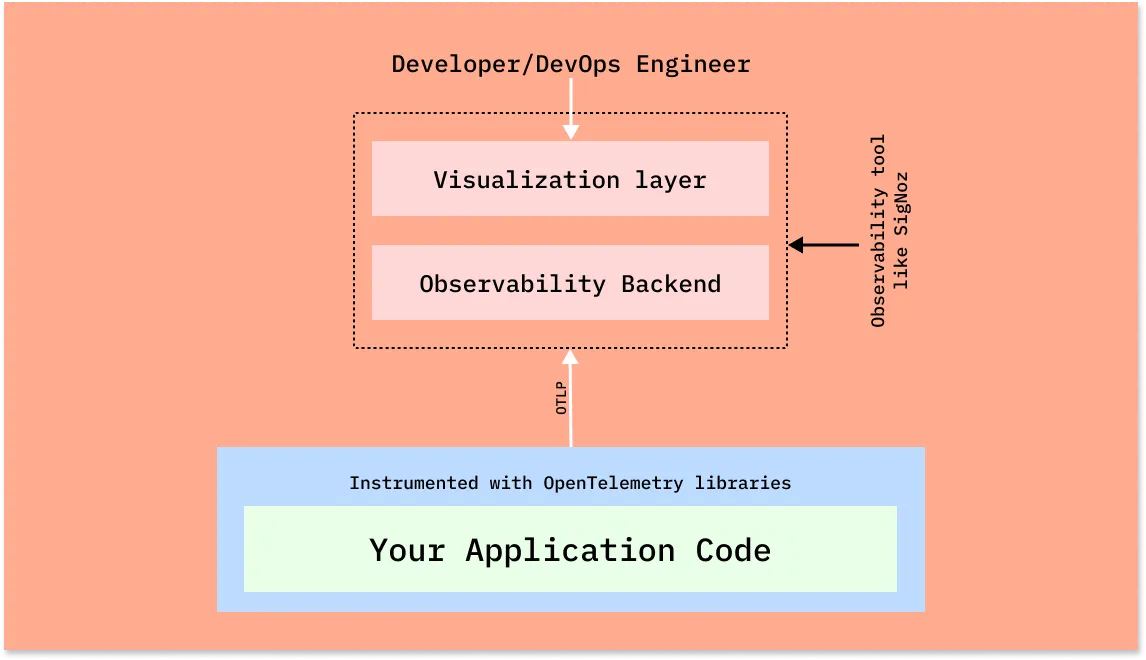
OpenTelemetry is the bedrock for setting up an observability framework. It also provides you the freedom to choose a backend analysis tool of your choice.
OpenTelemetry and SigNoz
In this article, we will use SigNoz as our backend analysis tool. SigNoz is a full-stack open-source APM tool that can be used for storing and visualizing the telemetry data collected with OpenTelemetry. It is built natively on OpenTelemetry and works on the OTLP data formats.
SigNoz provides query and visualization capabilities for the end-user and comes with out-of-box charts for application metrics and traces.
Now let’s get down to how to implement OpenTelemetry Ruby libraries and then visualize the collected data in SigNoz.
Install SigNoz
First, you need to install SigNoz so that OpenTelemetry can send the data to it.
SigNoz can be installed on macOS or Linux computers in just three steps by using a simple install script.
The install script automatically installs Docker Engine on Linux. However, on macOS, you must manually install Docker Engine before running the install script.
git clone -b main https://github.com/SigNoz/signoz.git
cd signoz/deploy/
./install.sh
You can visit our documentation for instructions on how to install SigNoz using Docker Swarm and Helm Charts.
When you are done installing SigNoz, you can access the UI at http://localhost:3301
Instrumenting a Ruby on Rails application with OpenTelemetry
Step 1: Install dependencies
Install dependencies related to OpenTelemetry SDK and exporter using gem.
gem install opentelemetry-sdk
gem install opentelemetry-exporter-otlp
gem install opentelemetry-instrumentation-all
Include the required packages into your gemfile.
gem 'opentelemetry-sdk'
gem 'opentelemetry-exporter-otlp'
gem 'opentelemetry-instrumentation-all'
To install dependencies run:
bundle install
Next, migrate the database:
rails db:migrate
Step 2: Initialize the OpenTelemetry SDK
Initialize the otel sdk by adding below lines to config/environment.rb of your Ruby on Rails application.
require 'opentelemetry/sdk'
require_relative 'application'

OpenTelemetry::SDK.configure do |c|
  c.use_all
end

Rails.application.initialize!
Step 3: Running your Ruby application
Now we have to set the following environment variables to export the collected telemetry data for storage and visualization.
OTEL_EXPORTER: It is the format of exported data. Since SigNoz natively supports otlp so it should be set asotlpOTEL_SERVICE_NAME: Name of service(anything you want)OTEL_EXPORTER_OTLP_ENDPOINT: Specify the endpoint of OTEL collector in formathttp://IP_OF_SIGNOZ:4318. The OTEL collector comes bundled with SigNoz installation. Since, we installed SigNoz on our local machine, the endpoint ishttp://localhost:4318.OTEL_RESOURCE_ATTRIBUTES: Pass custom attributes like application name withOTEL_RESOURCE_ATTRIBUTES=application=yourAppName
Using the above mentioned environment variables, run the application:
OTEL_EXPORTER=otlp OTEL_SERVICE_NAME=yourSampleRailsApp OTEL_EXPORTER_OTLP_ENDPOINT=http://localhost:4318 OTEL_RESOURCE_ATTRIBUTES=application=sparkapp rails server
Monitor your Ruby on Rails application with Signoz
After following above steps, you can now monitor your Rails app with SigNoz. You can use this sample Ruby on Rails app that was instrumented using above steps to see how the collected data is visualized with SigNoz dashboard.
To run the sample app use below commands
- Install dependencies:
bundle install - Migrate database:
rails db:migrate - Run the app with env variables:
OTEL_EXPORTER=otlp OTEL_SERVICE_NAME=sampleRailsApp OTEL_EXPORTER_OTLP_ENDPOINT=http://localhost:4318 OTEL_RESOURCE_ATTRIBUTES=application=sparkapp rails server
Now the app should be running at http://localhost:3000/
Play around with the app to generate some demo monitoring data, which will automatically be exported to the SigNoz Otel collector.
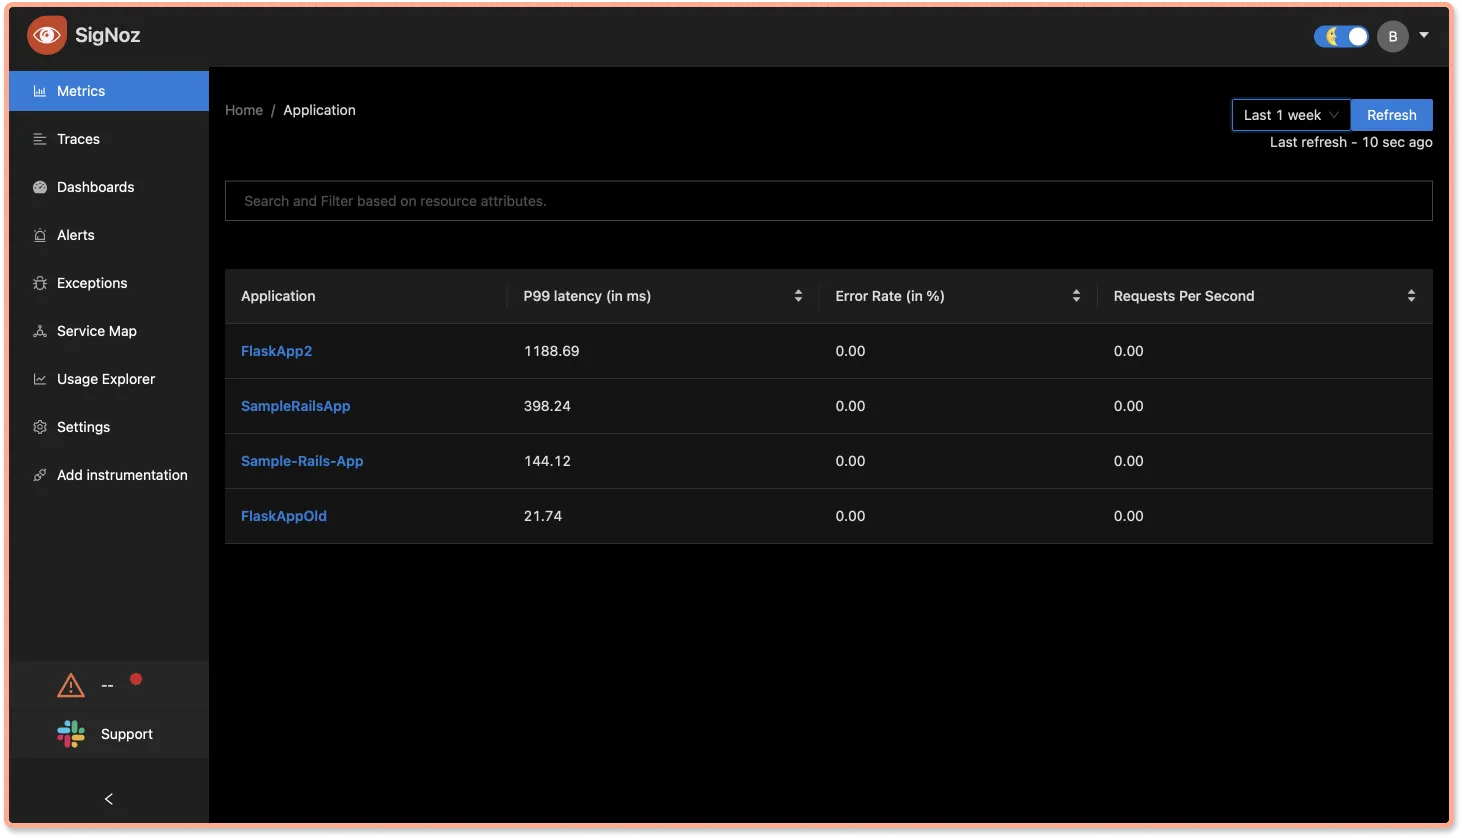
Now navigate to http://localhost:3301/application (needs signup) to analyse the telemetry data of Rails app.
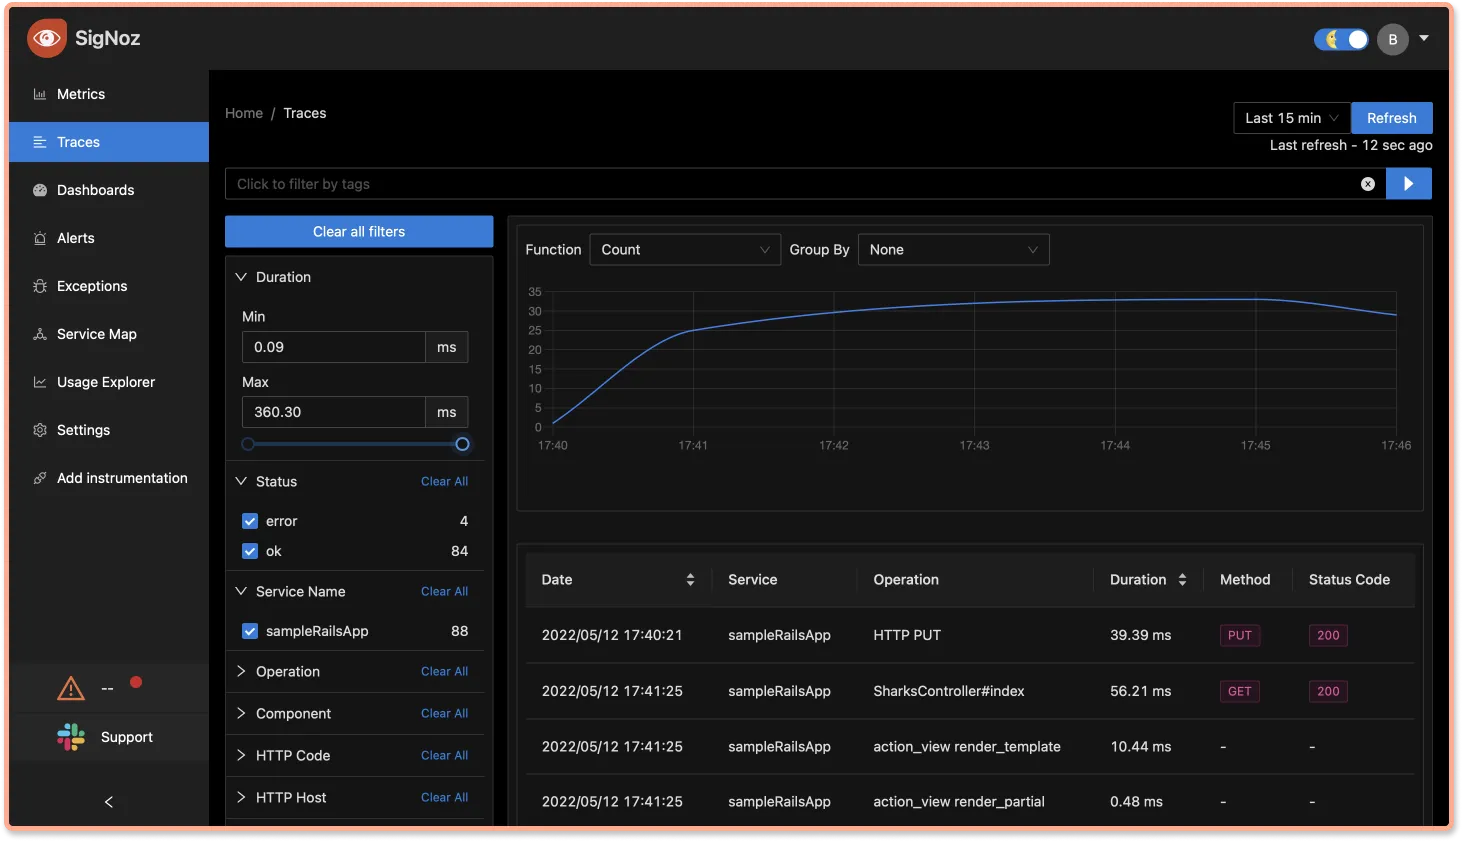
You can analyze your tracing data with powerful filters using the Traces tab on SigNoz dashboard.
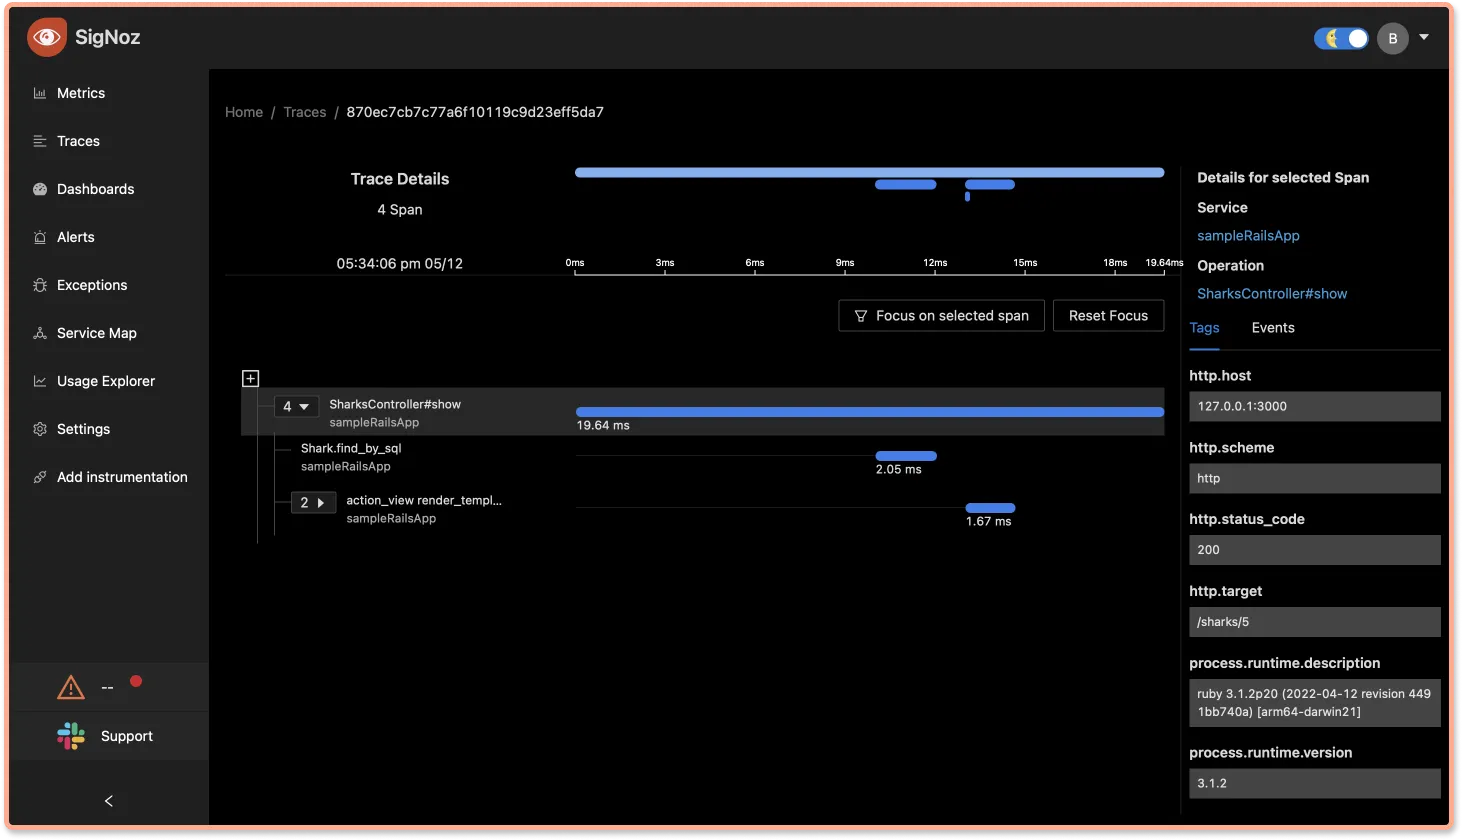
Using Flamegraphs and Gantt charts, you can see a complete breakdown of your request.
Conclusion
Using OpenTelemetry libraries, you can instrument your Ruby applications for setting up observability. You can then use an open-source APM tool like SigNoz to monitor the collected data.
OpenTelemetry is the future for setting up observability for cloud-native apps. It is backed by a huge community and covers a wide variety of technology and frameworks. Using OpenTelemetry, engineering teams can instrument polyglot and distributed applications with peace of mind.
SigNoz is an open-source observability tool that comes with a SaaS-like experience. You can try out SigNoz by visiting its GitHub repo 👇
If you are someone who understands more from video, then you can watch the below video tutorial on the same with SigNoz.

If you have any questions or need any help in setting things up, join our slack community and ping us in #support channel.


