OpenTelemetry can be used to trace React applications for performance issues and bugs. You can trace user requests from your frontend web application to your downstream services. OpenTelemetry is an open-source project under the Cloud Native Computing Foundation (CNCF) that aims to standardize the generation and collection of telemetry data.
React (also known as React.js or ReactJS) is a free and open-source frontend JavaScript library for building user interfaces based on UI components. It is maintained by Meta (formerly Facebook) and a community of individual developers and companies. React can be used as a base for developing single-page, mobile, or server-rendered applications with frameworks like Next.js.
However, React is only concerned with state management and rendering that state to the DOM, so creating React applications usually requires the use of additional libraries for routing, as well as certain client-side functionality.
Using OpenTelemetry Web libraries, you can instrument your React apps to generate tracing data. You can track user requests from your frontend web application to your downstream services.
Before we demonstrate how to implement the OpenTelemetry libraries, let’s have a brief overview of OpenTelmetry.
What is OpenTelemetry?
OpenTelemetry is an open-source vendor-agnostic set of tools, APIs, and SDKs used to instrument applications to create and manage telemetry data(logs, metrics, and traces). It aims to make telemetry data a built-in feature of cloud-native software applications.The telemetry data is then sent to an observability tool for storage and visualization.
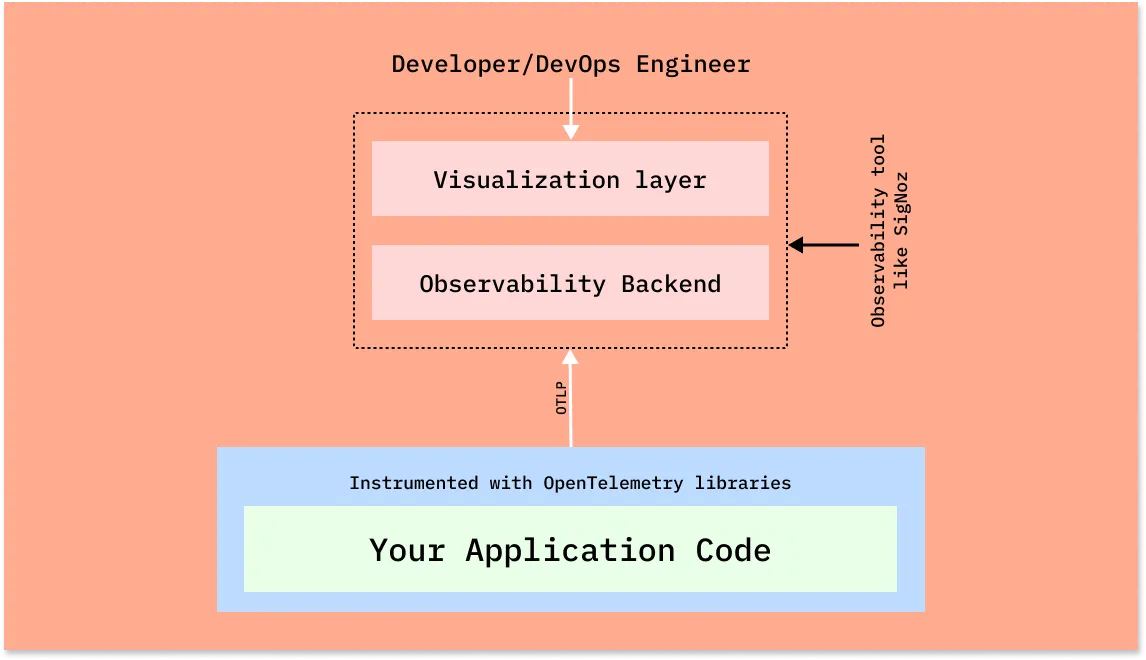
OpenTelemetry is the bedrock for setting up an observability framework. It also provides you the freedom to choose a backend analysis tool of your choice.
OpenTelemetry and SigNoz
In this article, we will use SigNoz as our backend analysis tool. SigNoz is a full-stack open-source APM tool that can be used for storing and visualizing the telemetry data collected with OpenTelemetry. It is built natively on OpenTelemetry and works on the OTLP data formats.
SigNoz provides query and visualization capabilities for the end-user and comes with out-of-box charts for application metrics and traces.
Now let’s get down to how to implement OpenTelemetry Web libraries and then visualize the collected data in SigNoz.
Running React application with OpenTelemetry
Step 1: Install SigNoz
First, you need to install SigNoz so that OpenTelemetry can send the data to it.
SigNoz can be installed on macOS or Linux computers in just three steps by using a simple install script.
The install script automatically installs Docker Engine on Linux. However, on macOS, you must manually install Docker Engine before running the install script.
git clone -b main https://github.com/SigNoz/signoz.git
cd signoz/deploy/
./install.sh
You can visit our documentation for instructions on how to install SigNoz using Docker Swarm and Helm Charts.
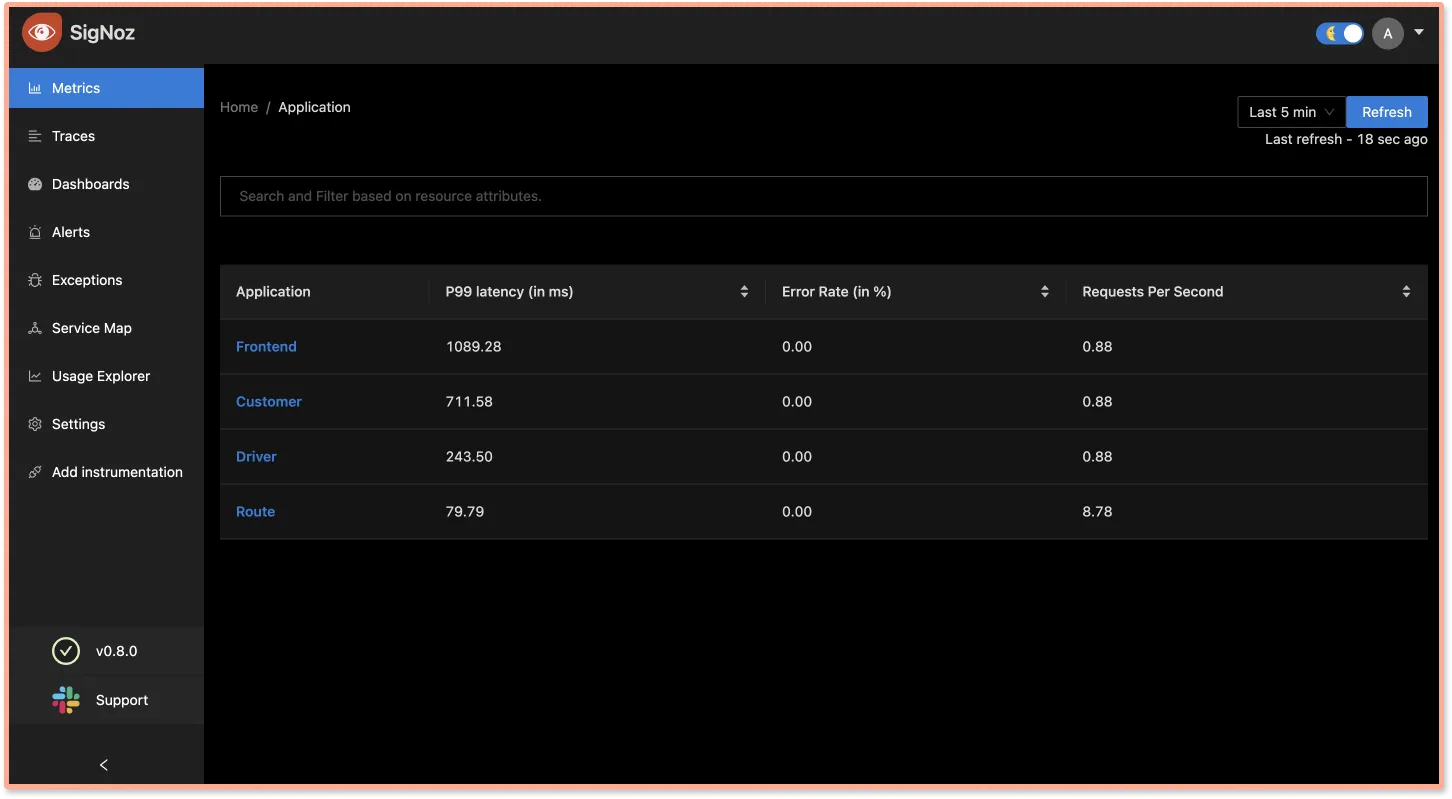
When you are done installing SigNoz, you can access the UI at http://localhost:3301
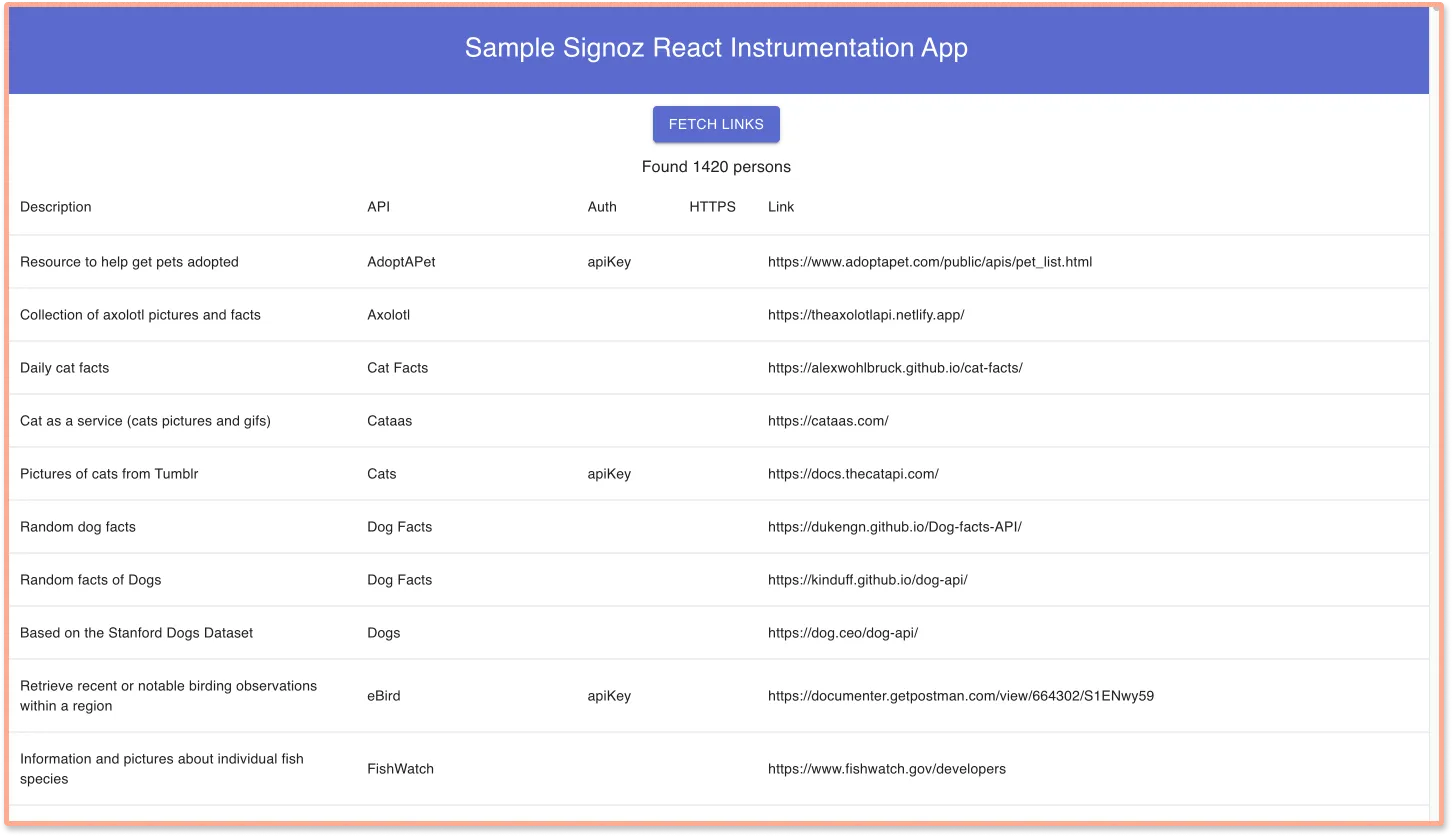
Step 2: Get sample React app
Sample React App
It contains the sample boilerplate code that we will instrument.
git clone git@github.com:SigNoz/sample-reactjs-app.git
Step 3: Enable CORS in the OTel Receiver
Enable CORS in the OTel Receiver. Under SigNoz folder, open the otel-collector-config.yaml file. The file is located at deploy/docker/clickhouse-setup/otel-collector-config.yaml
You can view the file at SigNoz GitHub repo. Inside the file add the following CORS config:
http:
  cors:
    allowed_origins:
      - https://netflix.com  # URL of your Frontend application
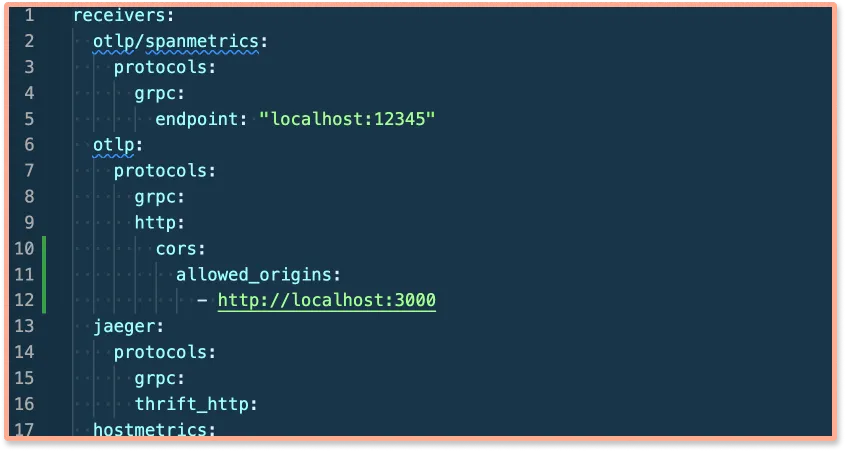
You need to update the URL in the config file to match your frontend application URL. For this tutorial, we will be running our frontend application on http://localhost:3000.
http:
  cors:
    allowed_origins:
      - http://localhost:3000
Once you make the changes, you need to restart the Docker containers.
To stop the running SigNoz cluster:
sudo docker-compose -f docker/clickhouse-setup/docker-compose.yaml stop
To start/resume the running SigNoz cluster:
sudo docker-compose -f docker/clickhouse-setup/docker-compose.yaml up
*Note: The stopped SigNoz cluster should resume and mount to the existing docker volumes.
Step 4: Instrument React app with OpenTelemetry
To instrument the React app with OpenTelemetry, we need to install the OpenTelemetry dependencies.
yarn add -D @opentelemetry/api@1.0.3 @opentelemetry/context-zone@1.0.0 @opentelemetry/exporter-collector@0.25.0@opentelemetry/instrumentation-fetch@0.25.0
Step 5: Update Service Name and CollectorTrace Exporter
The file is located at src/helpers/tracing/index.ts, in the sample react app codebase.
const serviceName = "sample-react-app";
const resource = new Resource({ "service.name": serviceName });
const provider = new WebTracerProvider({ resource });
const collector = new CollectorTraceExporter({
  url: "http://localhost:4318/v1/traces",
});
Step 6: Start the React app
Go to the root folder of your React application, and run the following command:
yarn start
Congratulations! You have successfully run your React application with OpenTelemetry. It’s time to see the collected data.
Step 7: Generate some data
In order to monitor your React application with SigNoz, you first need to generate some data.
Visit http://localhost:3000/ to access your frontend application. Using the UI, make some calls to the backend API. You can check the network tab in your browser to see the requests that you have made.

Step 8: Monitor your application with SigNoz
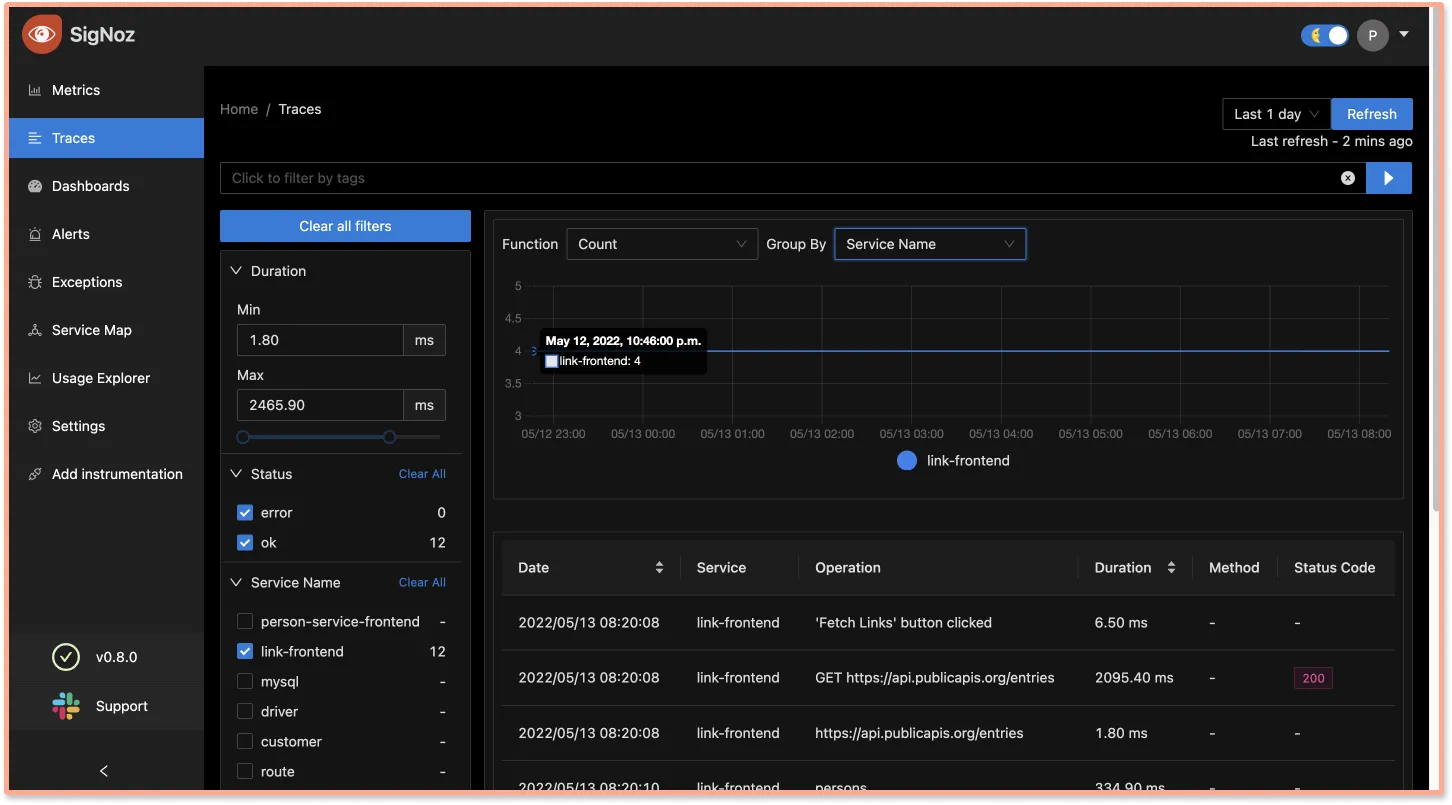
With SigNoz, you can monitor the data collected by OpenTelemetry from your sample React application. You can see end-to-end traces for your React application.
You can analyze your tracing data with powerful filters using the Traces tab on SigNoz dashboard.
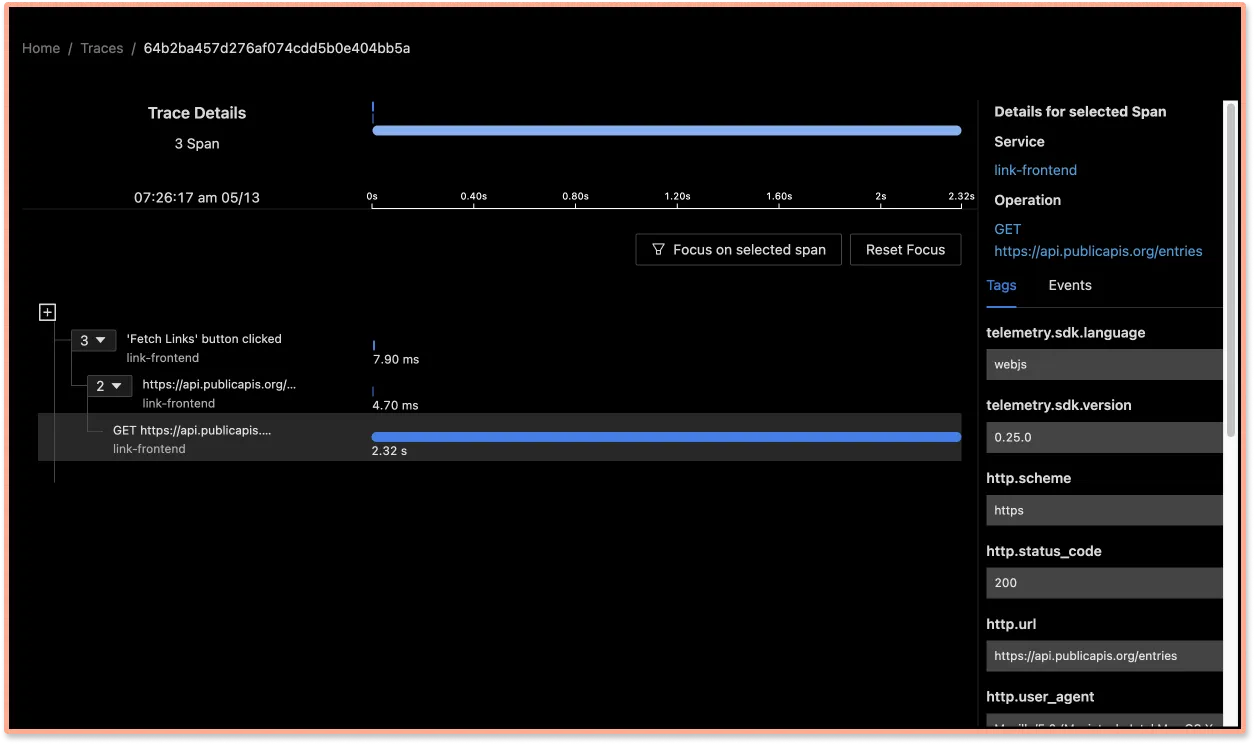
Using Flamegraphs and Gantt charts you can see a complete breakdown of your request.
Conclusion
Using OpenTelemetry Web libraries, you can instrument your frontend applications for end-to-end tracing. You can then use an open-source APM tool like SigNoz to ensure the smooth performance of your React applications.
OpenTelemetry is the future for setting up observability for cloud-native apps. It is backed by a huge community and covers a wide variety of technology and frameworks. Using OpenTelemetry, engineering teams can instrument polyglot and distributed applications with peace of mind.
SigNoz is an open-source observability tool that comes with a SaaS-like experience. You can try out SigNoz by visiting its GitHub repo 👇
If you are someone who understands more from video, then you can watch the our video tutorial on how to implement OpenTelemetry React libraries and monitor the application with SigNoz.
If you have any questions or need any help in setting things up, join our slack community and ping us in #support channel.


