Nestjs is a Nodejs framework for building scalable server-side applications with typescript. It makes use of frameworks like Express and Fastify to enable rapid development. It has gained wide popularity in recent times, and many applications are making use of the Nestjs framework.
Monitoring your Nestjs application is critical for performance management. But setting up monitoring for Nestjs applications can get cumbersome requiring multiple libraries and patterns. That's where Opentelemetry comes in.
OpenTelemetry is the leading open-source standard for instrumenting your code to generate telemetry data that can be a one-stop solution for monitoring Nestjs applications.
OpenTelemetry is a set of tools, APIs, and SDKs used to instrument applications to create and manage telemetry data(Logs, metrics, and traces). It aims to make telemetry data(logs, metrics, and traces) a built-in feature of cloud-native software applications.
One of the biggest advantages of using OpenTelemetry is that it is vendor-agnostic. It can export data in multiple formats, which you can send to a backend of your choice.
In this article, we will use SigNoz as a backend. SigNoz is an open-source APM tool that can be used for both metrics and distributed tracing.
Let's get started and see how to use OpenTelemetry for a Nestjs application.
Running a Nestjs application with OpenTelemetry
First, you need to install SigNoz. Data collected by OpenTelemetry will be sent to SigNoz for storage and visualization.
Installing SigNoz
You can get started with SigNoz using just three commands at your terminal.
git clone -b main https://github.com/SigNoz/signoz.git
cd signoz/deploy/
./install.sh
For detailed instructions, you can visit our documentation.
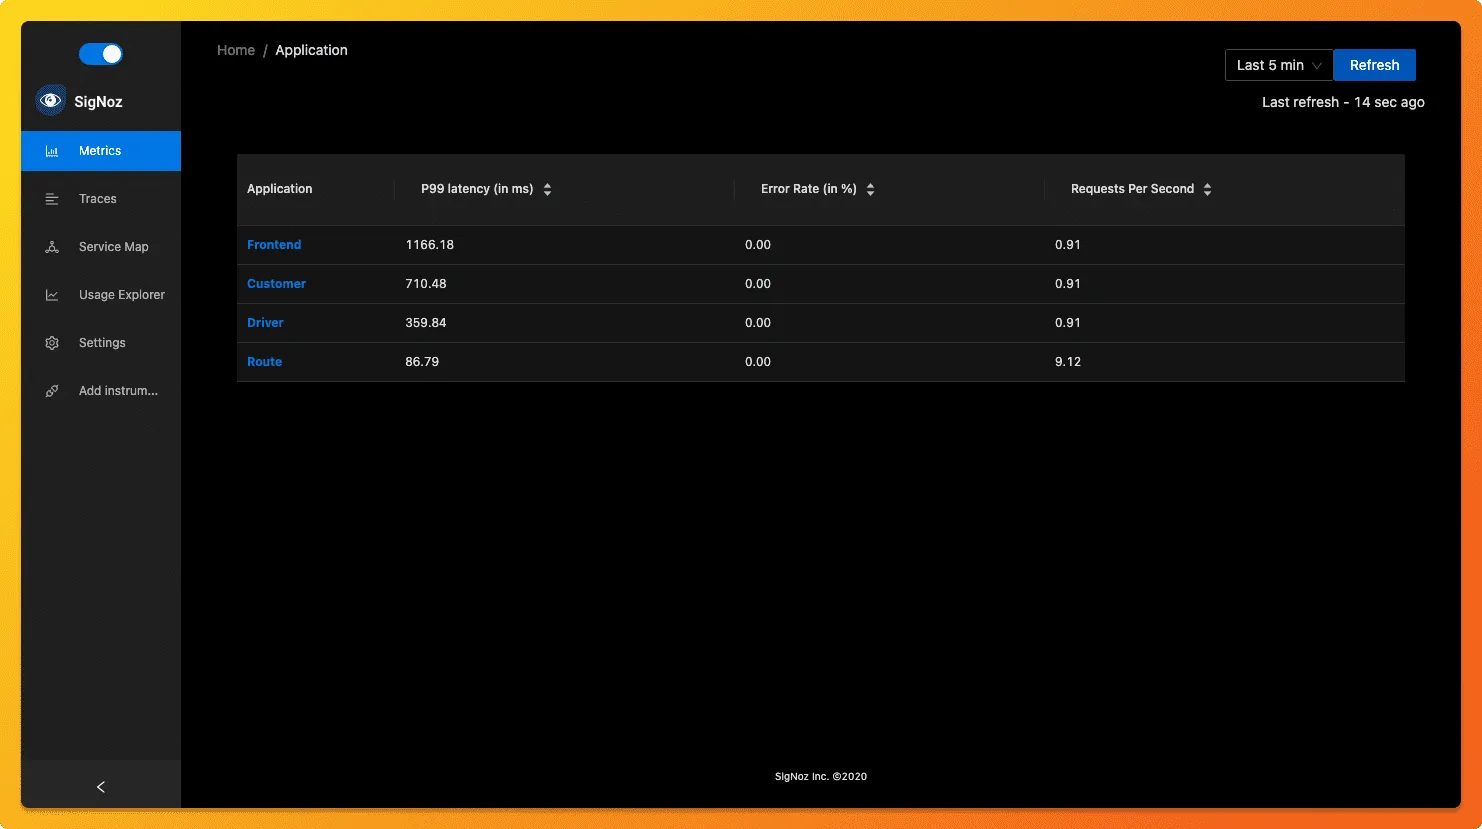
If you have installed SigNoz on your local host, you can access the UI at: http://localhost:3301
The application list shown in the dashboard is from a sample app called HOT R.O.D that comes bundled with the SigNoz installation package.
Instrumenting a sample Nestjs application with OpenTelemetry
For instrumenting a Nestjs application with OpenTelemetry, you need to install the required OpenTelemetry packages first. Steps involved in instrumenting a Nestjs application with OpenTelemetry are as follows:
- Install below dependencies
npm install --save @opentelemetry/api
npm install --save @opentelemetry/sdk-node
npm install --save @opentelemetry/auto-instrumentations-node
npm install --save @opentelemetry/exporter-trace-otlp-grpc
npm install --save @grpc/grpc-js
- Create a
tracer.tsfile
The IP of SIgNoz will be localhost if you are running SigNoz on local.
'use strict'

const opentelemetry = require('@opentelemetry/sdk-node');
const { getNodeAutoInstrumentations } = require('@opentelemetry/auto-instrumentations-node');
const { OTLPTraceExporter } = require('@opentelemetry/exporter-trace-otlp-grpc');
const { Resource } = require('@opentelemetry/resources');
const { SemanticResourceAttributes } = require('@opentelemetry/semantic-conventions');
const grpc = require('@grpc/grpc-js');

// configure the SDK to export telemetry data to the console
// enable all auto-instrumentations from the meta package
const exporterOptions = {
  url: 'http://localhost:4317',
  credentials: grpc.credentials.createInsecure(),
}
const traceExporter = new OTLPTraceExporter(exporterOptions);
const sdk = new opentelemetry.NodeSDK({
  traceExporter,
  instrumentations: [getNodeAutoInstrumentations()],
  resource: new Resource({
    [SemanticResourceAttributes.SERVICE_NAME]: 'sampleNestJsApp'
  }),
});

// initialize the SDK and register with the OpenTelemetry API
// this enables the API to record telemetry
sdk.start()
  .then(() => console.log('Tracing initialized'))
  .catch((error) => console.log('Error initializing tracing', error));

// gracefully shut down the SDK on process exit
process.on('SIGTERM', () => {
  sdk.shutdown()
    .then(() => console.log('Tracing terminated'))
    .catch((error) => console.log('Error terminating tracing', error))
    .finally(() => process.exit(0));
});

module.exports = sdk
- Import the tracer module where your app starts
Onmain.tsfile or file where your app starts import tracer using below command:
const tracer = require('./tracer')
- Start the tracer
await tracer.start();
You can now run your Nestjs application. The data captured with OpenTelemetry from your application should start showing on the SigNoz dashboard.
You can check out a sample Nestjs application already instrumented with OpenTelemetry here:
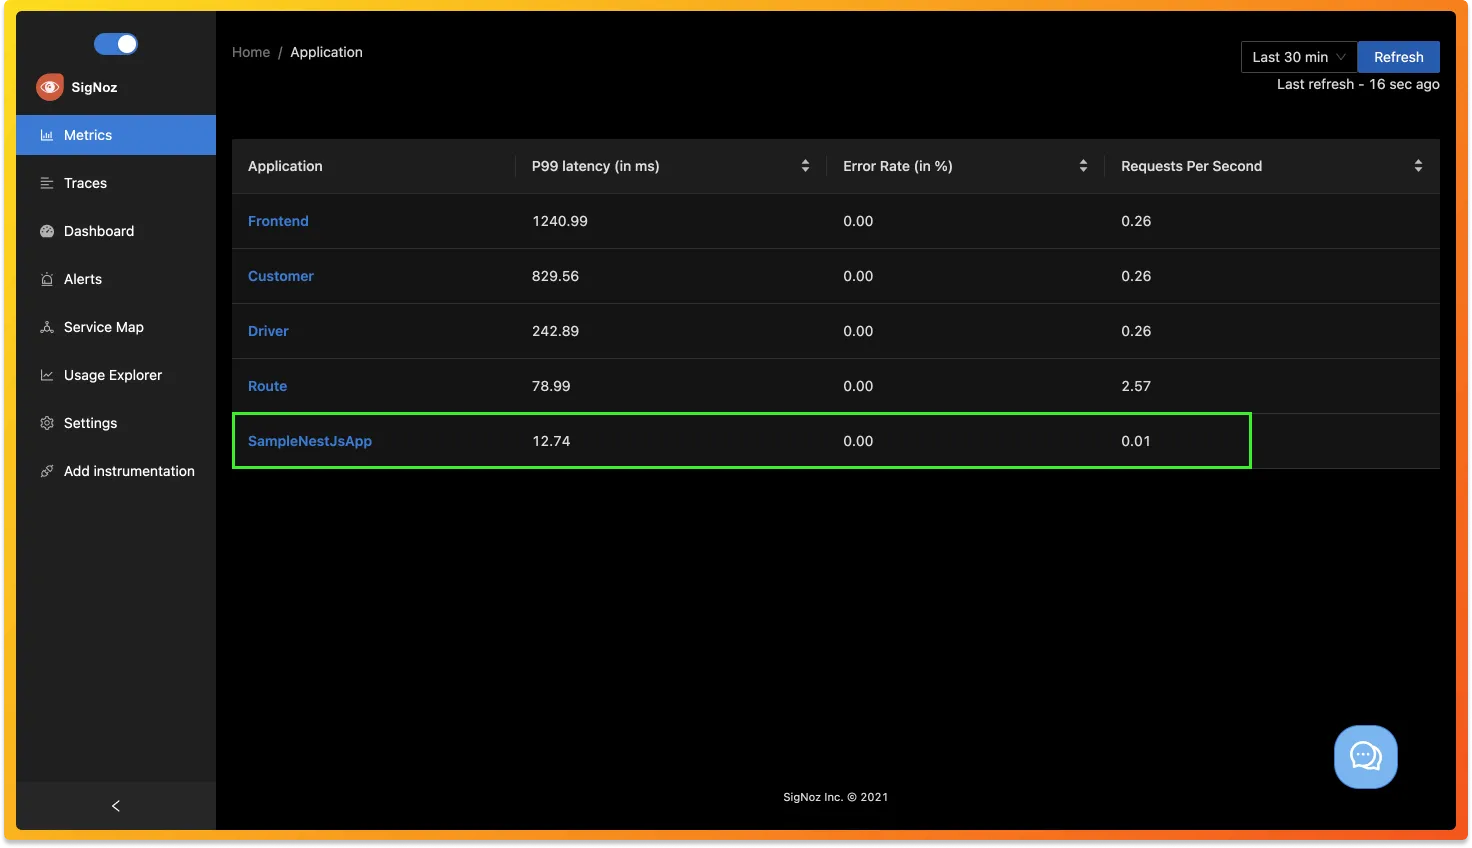
If you run this app, you can find a SampleNestJsApp in the list of applications monitored with SigNoz.
Open-source tool to visualize telemetry data
SigNoz makes it easy to visualize metrics and traces captured through OpenTelemetry instrumentation.
SigNoz comes with out of box RED metrics charts and visualization. RED metrics stands for:
- Rate of requests
- Error rate of requests
- Duration taken by requests
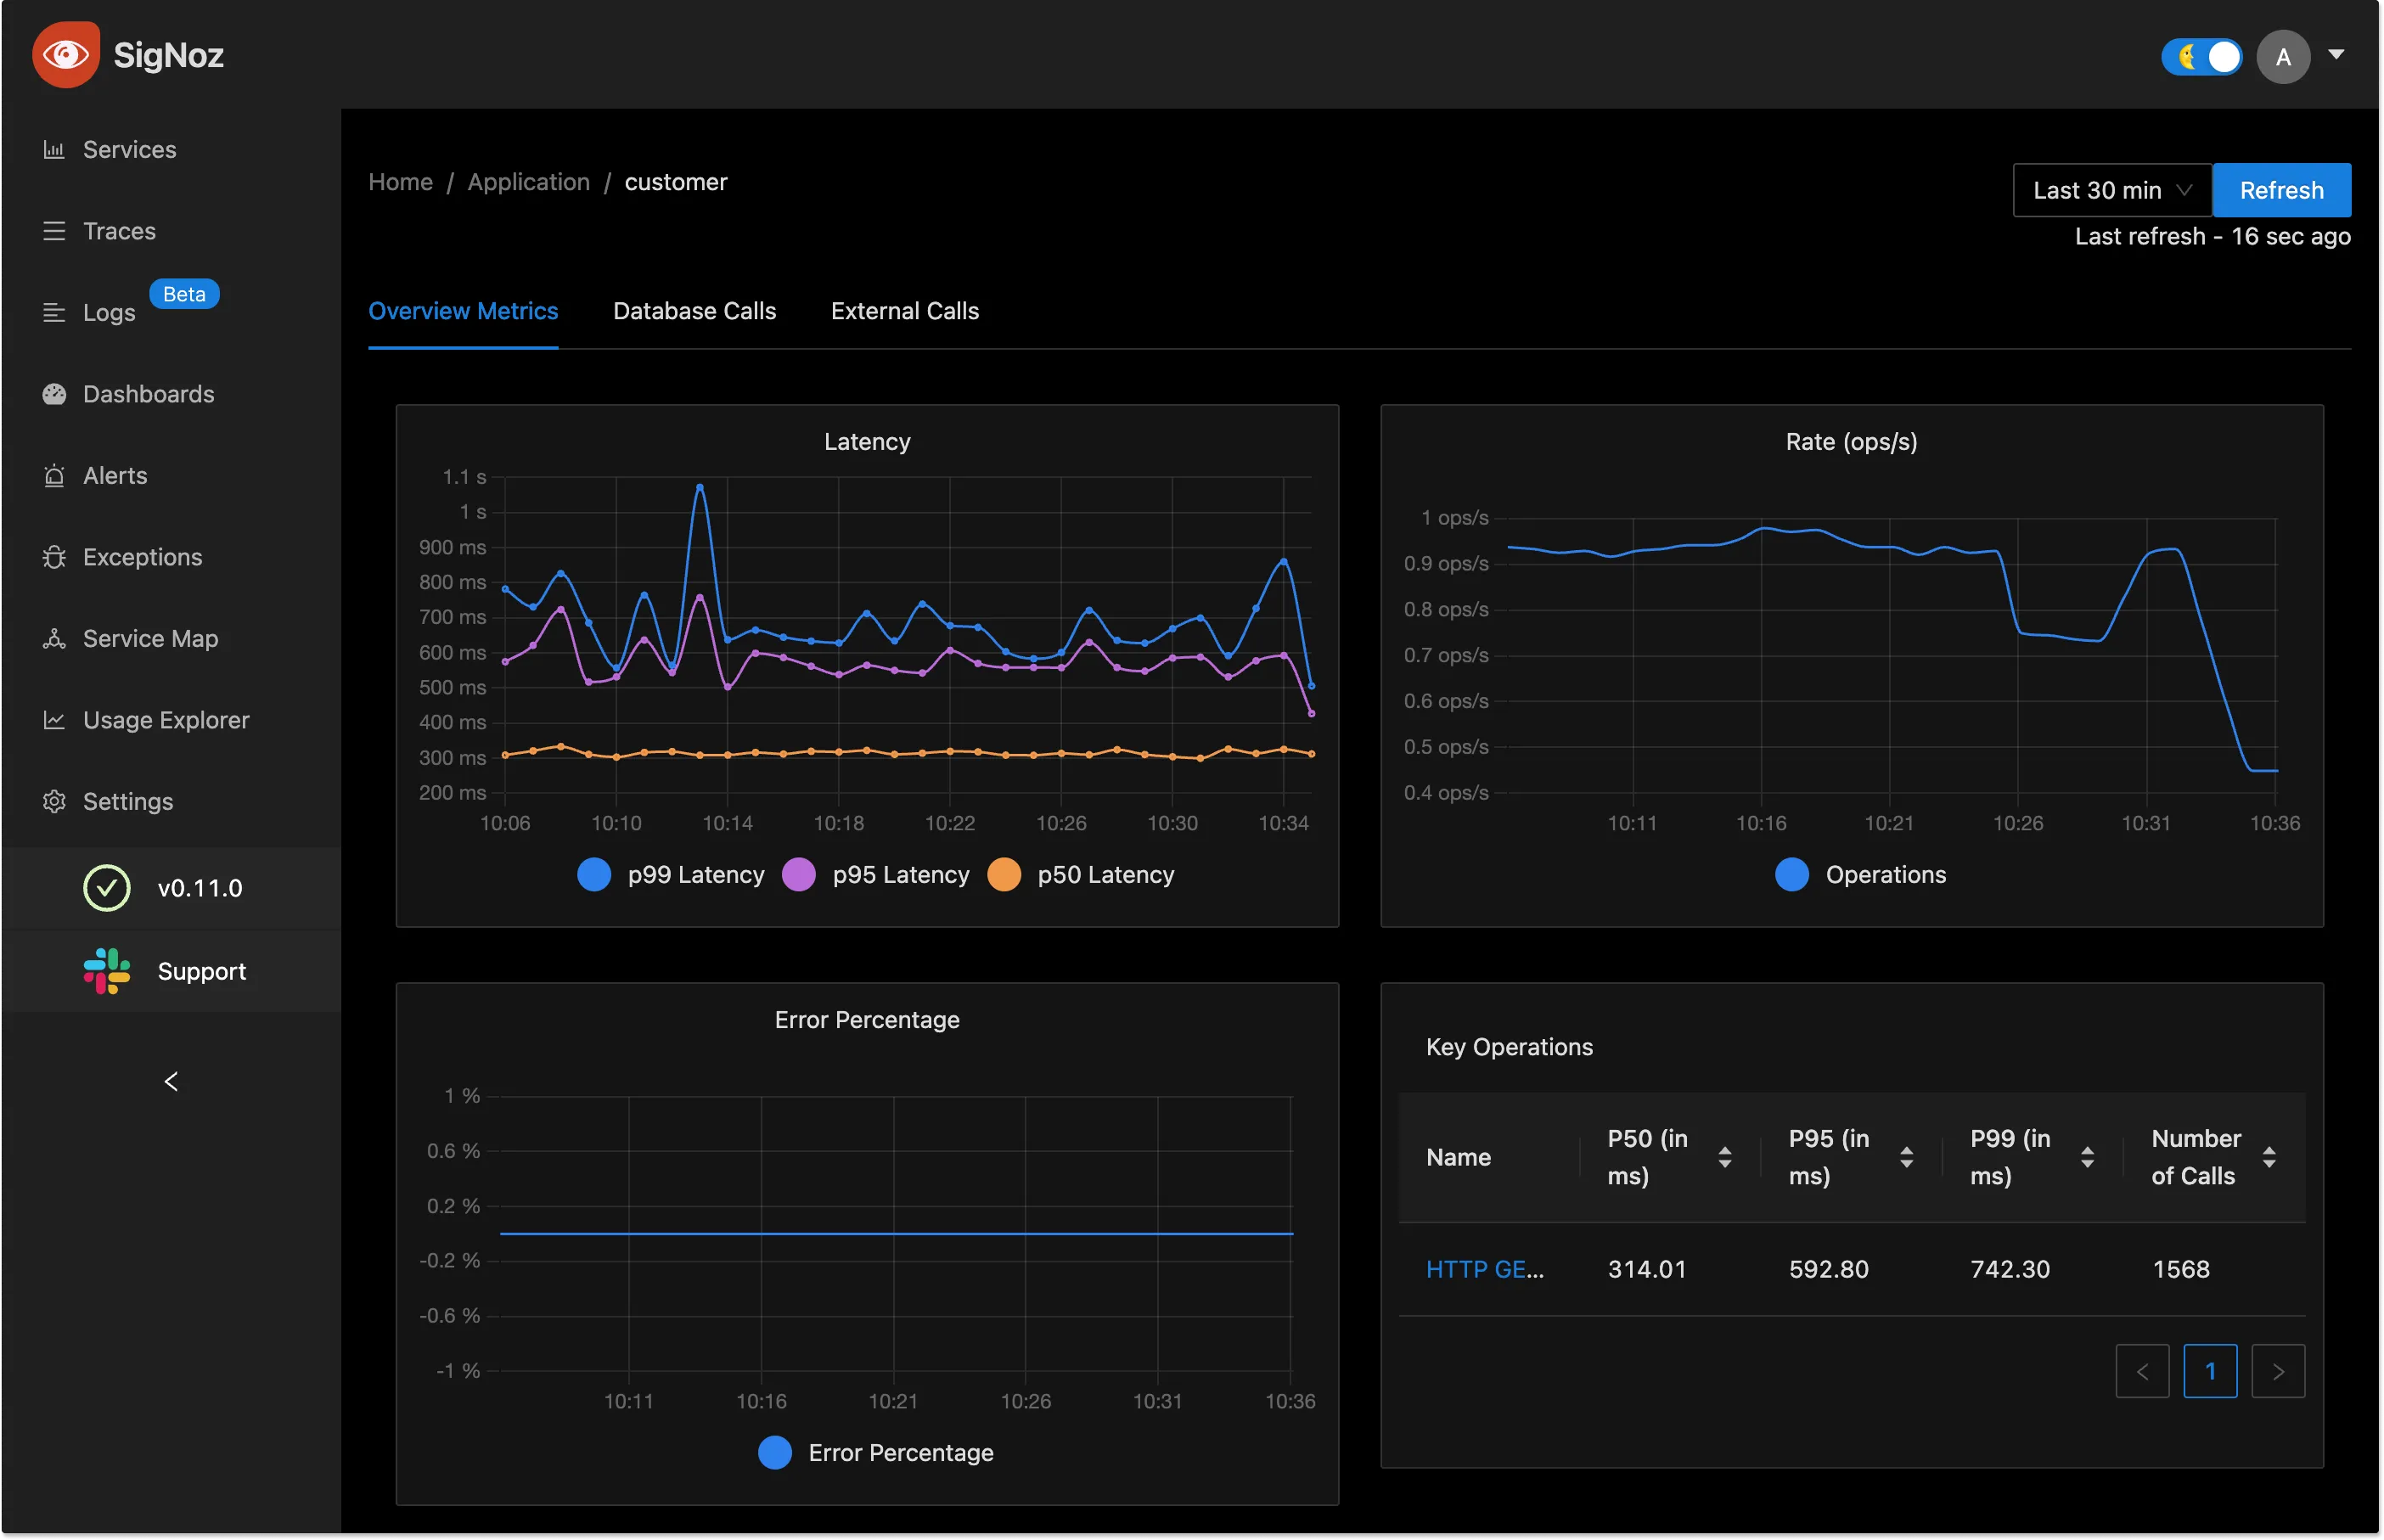
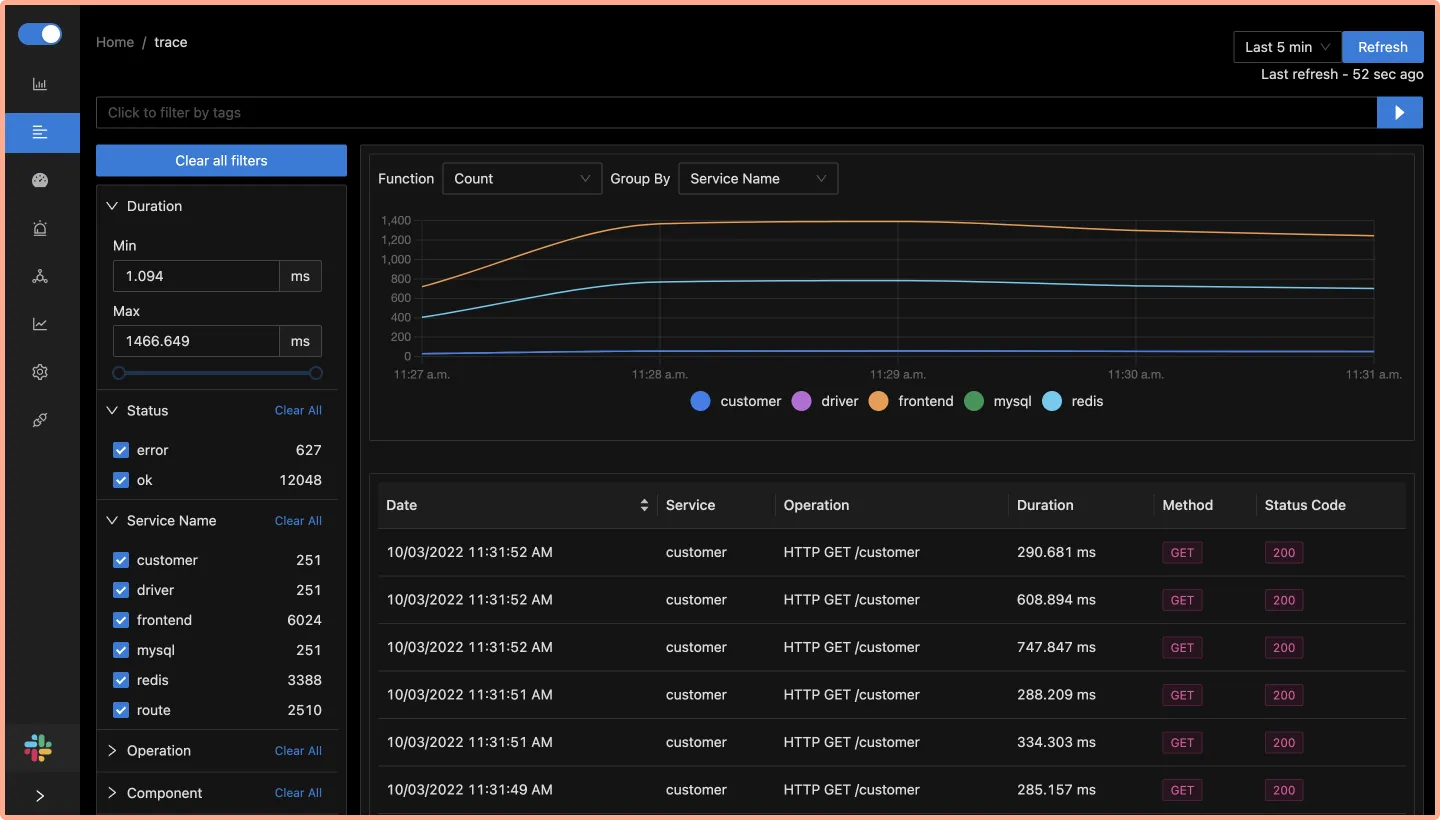
You can then choose a particular timestamp where latency is high to drill down to traces around that timestamp.
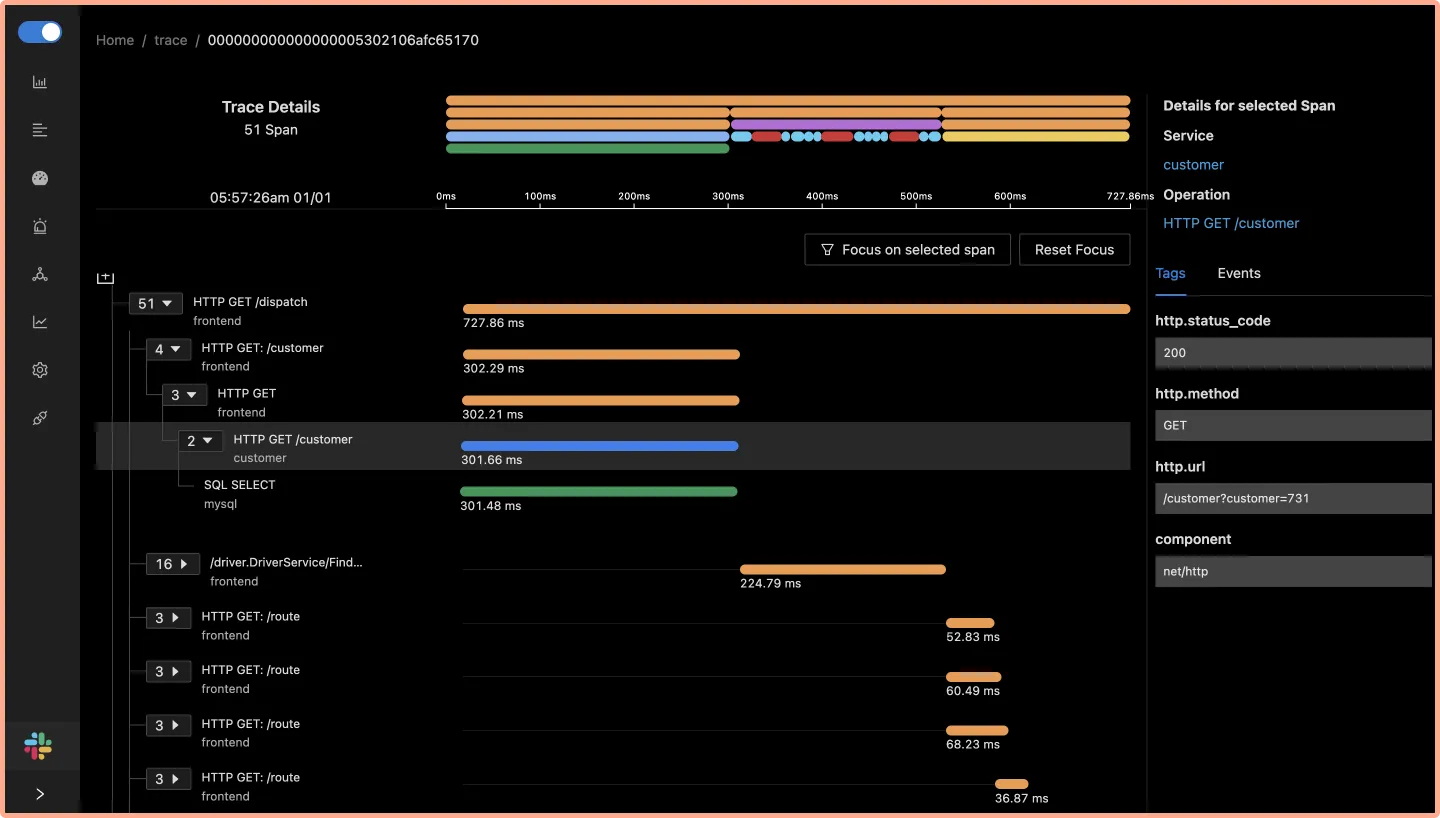
You can use flamegraphs to exactly identify the issue causing the latency.
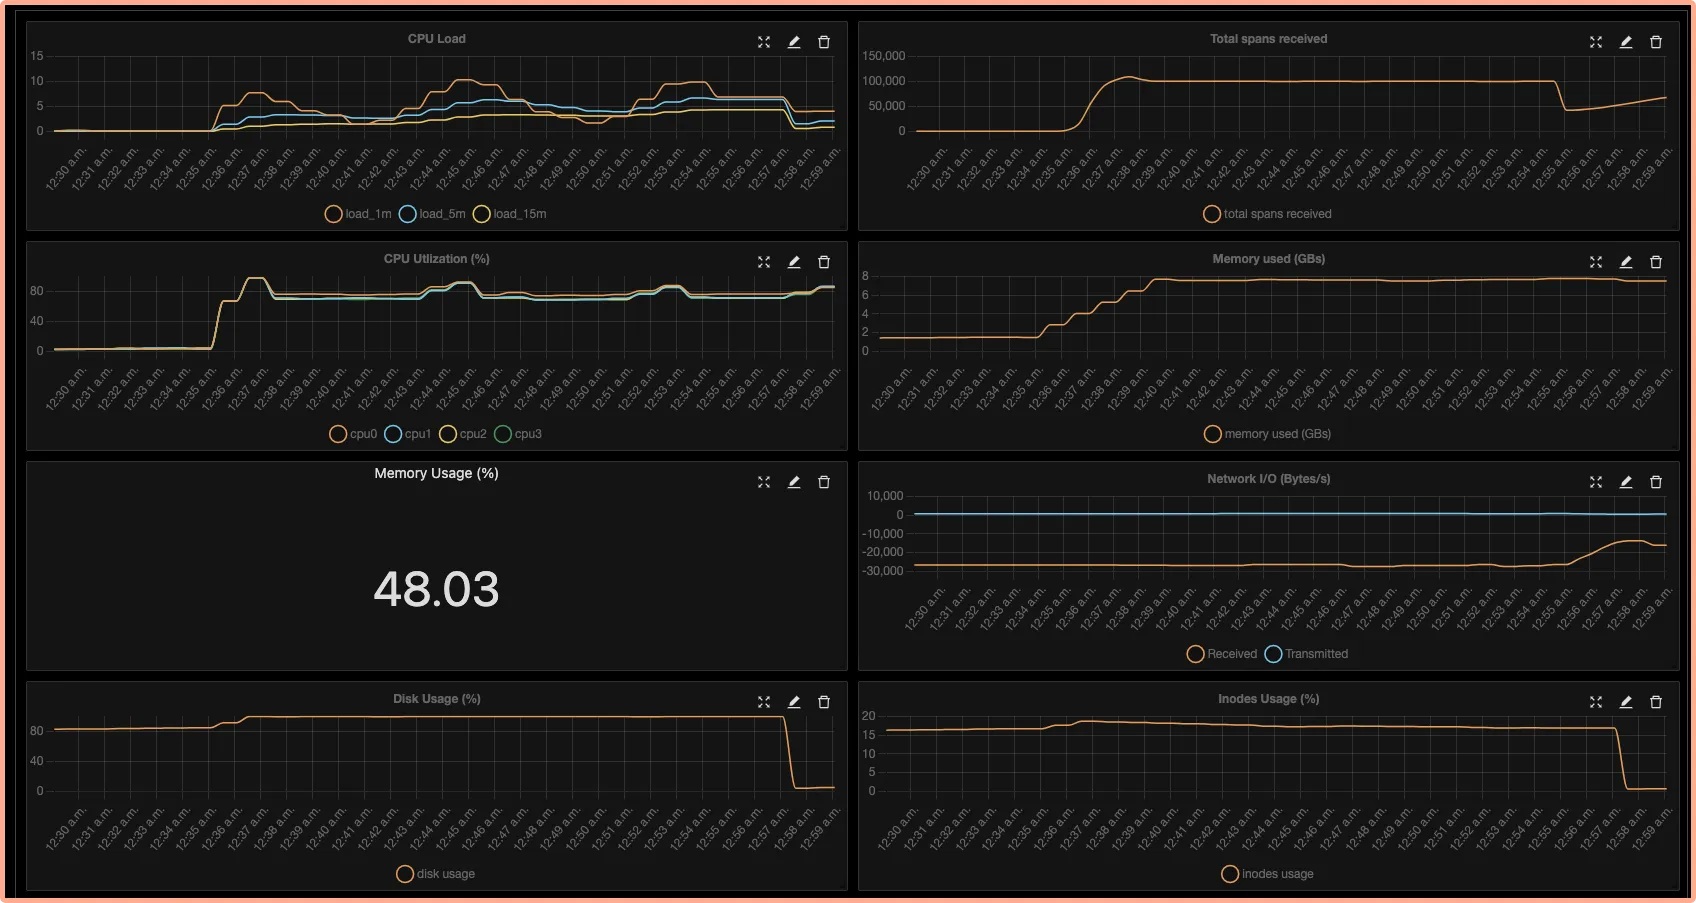
You can also build custom metrics dashboard for your infrastructure.
Conclusion
OpenTelemetry makes it very convenient to instrument your Nestjs application. You can then use an open-source APM tool like SigNoz to analyze the performance of your app. As SigNoz offers a full-stack observability tool, you don't have to use multiple tools for your monitoring needs.
You can try out SigNoz by visiting its GitHub repo 👇

If you are someone who understands more from video, then you can watch the below video tutorial on the same with SigNoz.
If you have any questions or need any help in setting things up, join our slack community and ping us in #support channel.
If you want to read more about SigNoz 👇


