OpenTelemetry is an instrumentation standard for application monitoring - both for monitoring metrics & distributed tracing. In this blog, we take you through a hands on guide on how to run this on Kubernetes.

At SigNoz, we support OpenTelemetry as an instrumentation standard - and provide an easy way to accomplish application monitoring leveraging the same. As a first step, we are sharing a detailed guide for developers/devops/SRE folks who want to get started with OpenTelemetry stack on Kubernetes.
OpenTelemetry’s vendor neutral APIs and data formats form its core capability to act as both a metric and trace delivery pipeline has been an amazing step in the observability space. As per the project roadmap, logs too would be included to encompass the final of The Three Pillars of Observability.
The Lineage of an Open Standard
OpenTelemerty is the culmination of a two decades worth of effort into observability standards and vendor neutral APIs. Inspired by papers and implementations from early 2000s, Google had built Dapper, an internal tool for auto-instrumentation and distributed tracing of the Google Search related micro-services. Google released the Dapper paper in 2010 and set the modern tracing ecosystem in motion.
Soon, Twitter had its own implementation of the Dapper paper called Zipkin, backed by Cassandra backend and the famed Finagle RPC framework. Uber was already running it’s internal tracing tool called Merckx, that slowly morphed into Jaeger by 2015 borrowing inspiration from both Dapper and open-zipkin. Initially Jaeger directly used the zipkin-ui component.
Maintainers of Dapper (Ben Sigelman), Zipkin (Adrian Cole) and Jaeger (Yuri Shkuro) came together in 2016 to write the first specification for OpenTracing in 2016. OpenTracing soon got accepted as the third incubated project under CNCF (Cloud Native Computing Foundation) the same year. It focused on vendor neutral APIs for consumption of traces.
Google open sourced it’s internal Census tool as OpenCensus circa 2018, this open standard had API implementations for both traces and metrics. Around the same time W3C (World Wide Web Consortium) also started working on the Trace Context and Correlation Context header specifications to efficiently communicate traceIDs over HTTP.
In March 2019, Ben Sigelman announced that OpenTracing and OpenCensus projects had decided to merge to further their common goals of an open standards based interoperability and vendor neutral observability ecosystem.
Fig 1. A short graphical history of the open-telemetry project
Architecture
OpenTelemetry offers standard vendor neutral APIs for collecting metrics and traces from applications and libraries to convert most existing data formats to another.
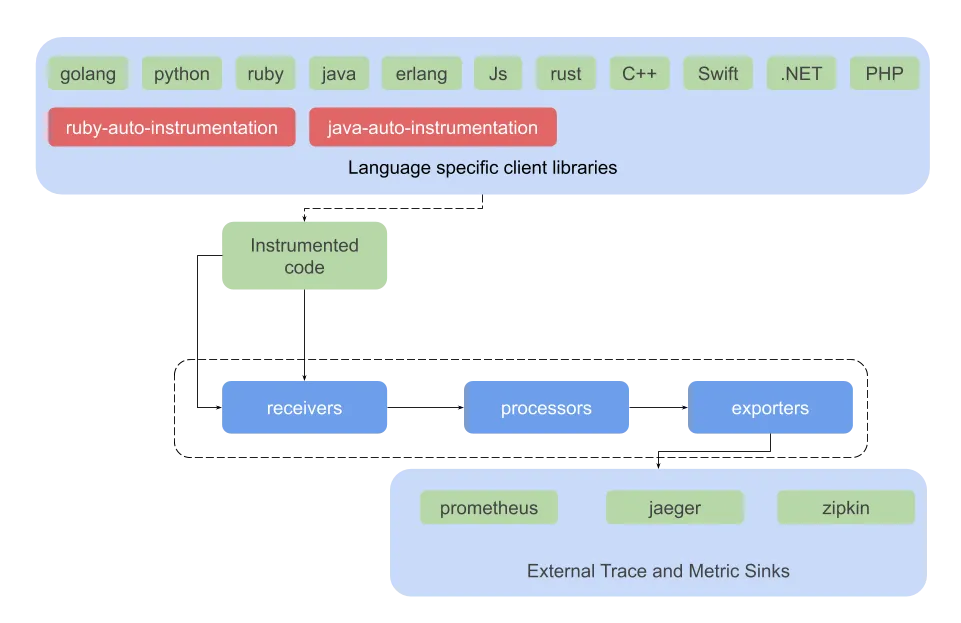
The code is instrumented either with any of OpenTelemetry’s provided language-specific client libraries, auto-instrumentation libraries or using any of the existing vendor libraries like jaeger, opentracing, opencensus, zipkin.
Receivers collect the data from all available sources and convert them to internal format before sending out to processors. OTLP is OpenTelemetry’s internal wire protocol and the intermediate data format for all other open / proprietary formats for telemetry data.
 Fig 2. Open-telemetry data flow
The OTLP receiver collects data from code instrumented with provided client libraries, while there are specific receivers available for many of the current instrumentation vendors / FOSS projects.
Processors would then pre-process data before sending it to a specific exporter as defined in the pipeline. They queue and batch the received data and implement retry mechanisms to prevent lossy transmissions. They may do validations before either refusing or accepting telemetry data. Additionally a processor can add / remove attributes as needed and sample the data before sending them to all available exporters.
Exporters are again vendor / data-sink specific like receivers. They receive massaged, possibly sampled data from processors and convert that to a target data-sink specific format and implement communication protocols for such data sinks.
A Pipeline defines a combination of various metric and trace receivers, a set of processors and a final set of metrics and trace receivers.
Fig 3. OpenTelemetry Receivers, Processors and Exporters : Core components in green, contrib components in Red
The core receivers, processors and exporters live on the https://github.com/open-telemetry/opentelemetry-collector repo. However, many other community contributed ones can be found on the official contrib repo at https://github.com/open-telemetry/opentelemetry-collector-contrib.
Fig. 3 provides a snapshot view of available components as of now.
Please note that the above lists and diagrams are not exhaustive and only indicative, new receivers and exporters are constantly being added by the community.
Deploying to Kubernetes
We will now try and deploy a fully working example of open-telemetry collector in kubernetes. We assume familiarity with kubernetes objects like Deployment, Service, Daemonset, ConfigMap etc going ahead.
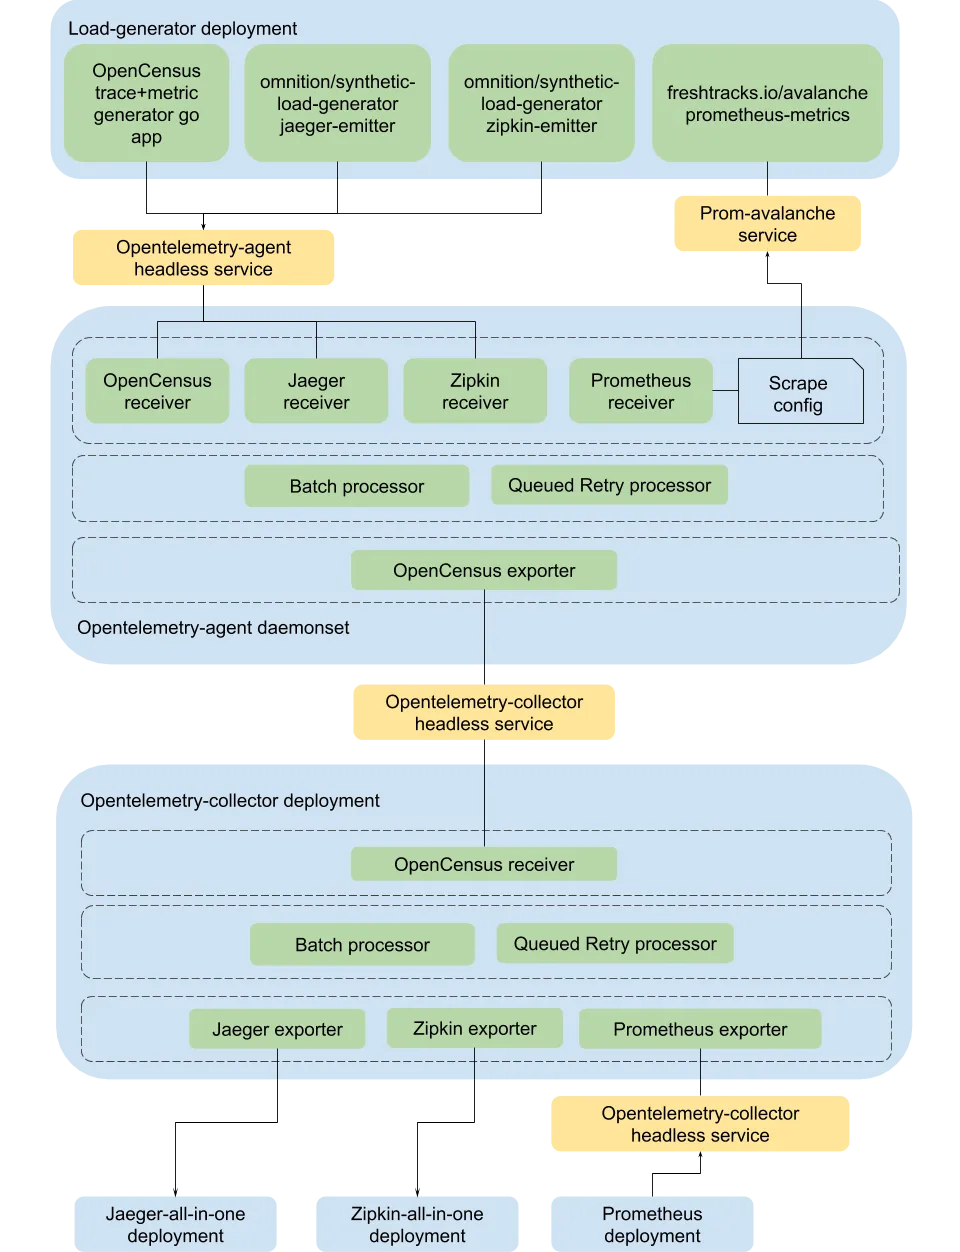
 Fig 4. Opentelemetry-collector kubernetes deployment
We use a load-generator deployment that generates simulated metrics and traces for OpenTelemetry stack to consume, this consists of:
- A simple go app deployment with OpenCensus instrumented traces and metrics
- Source: https://github.com/open-telemetry/opentelemetry-collector/blob/master/examples/main.go
- Omnition’s synthetic-load-generator
- Jaeger traces
- Zipkin traces
- Freshtracks.io’s prometheus metrics load generator - Avalanche
For each of the above data sources, we configure a corresponding receiver in opentelmetry agent which runs as a daemonset. While the opencensus, jaeger and zipkin receivers are push based, with the app having to push traces and metrics to a pre-configured endpoint; the prometheus receiver is pull based, one just needs to write standard prometheus scrape-configs on the sources /metrics endpoint in order to receive the metrics.
One caveat to note here is that since all above receivers work on GRPC ports, the agent needs to expose them through an headless service with ClusterIP: None, so that individual pod IPs are exposed through the Endpoint object, making sure grpc clients on the load-generator deployment don’t break connection.
Once the traces and metrics have been consumed by opentelemetry-agent, they are converted to the internal format and then sent to the opencensus exporter through both the batch and queued-retry processors.
The OpenCensus exporter on the agent then sends this combined data to opentelemetry collector deployment exposed through a headless service as before. Also to note, since the agent and collector are the same binary and entirely identical in functionality, the differentiation of a collector from an agent only differs in resource allocation. The agent has a lower resource quota usage than a collector, one can also configure memory usage using the Memory Limiter processor in both cases.
Thus, the collected trace and metrics data through the opencensus receiver is routed through the batch and queued-retry processors on the collector to the three exporters configured in the pipeline, one each for jaeger, zipkin and prometheus.
Each of these exporters in turn send data to final sinks:
- Jaeger-all-in-one deployment
- Zipkin-all-in-one deployment
- Single replica prometheus deployment
The processed metrics are exposed at :8889 for the prometheus deployment to scrape, whereas the collector’s own metrics can also be scraped on :8888 separately.
Please remember all the above trace, metrics sinks are for demonstration only, it’s not advisable to run any of the all-in-one deployments in production. We recommend using the jaeger and prometheus operators respectively for running production workloads. OpenTelemetry itself has an operator in the works, which we are currently evaluating internally. We might do future posts on the same.
The source code for this post is available at below link:
Given the scope and expanse of the Opentelemetry project, we barely scratched the surface of the possibilities, and even important aspects like tail-sampling. That said, following this post should get one bootstrapped easily with a running OpenTelemetry stack on your own cluster.
If you want to learn more about Open telemetry or how we are using it at SigNoz, feel free to reach out to us at:
References
- Google Dapper paper
- OpenCensus: A Stats Collection and Distributed Tracing Framework
- Distributed Systems Tracing with Zipkin
- Evolving Distributed Tracing at Uber Engineering
- Towards Turnkey Distributed Tracing
- Trace-Context and the road toward trace tool interoperability
- Merging OpenTracing and OpenCensus: Goals and Non-Goals
- Github - Otel Collector
- Github - Otel Spec

