OpenTelemetry is a Cloud Native Computing Foundation(CNCF) project aimed at standardizing the way we instrument applications for generating telemetry data(logs, metrics, and traces). However, OpenTelemetry does not provide storage and visualization for the collected telemetry data. An APM that can ingest telemetry data collected by OpenTelemetry can help you set up a robust observability stack.
APM stands for Application Performance Monitoring or Application Performance Management. APM tools help engineering teams effectively monitor their applications by monitoring key metrics for application performance. With time, the way applications are built and deployed has changed. With containerization technologies, software systems have become distributed and are more dynamic than ever in production environments.
APM tools have also evolved to newer ways of reporting metrics for container-based applications. For newer age architectures like microservices and serverless, it’s difficult for engineering teams to have a central overview of how their applications are performing. But monitoring technology also evolved and gave birth to distributed tracing. With distributed tracing, you can trace user requests across services and protocols.
But setting up a robust monitoring and observability stack is challenging in distributed applications. The first step for setting up observability is to instrument your applications for generating telemetry data. OpenTelemetry provides a consistent instrumentation layer for your entire application stack, including open source frameworks and libraries. Let’s learn more about OpenTelemetry.
What is OpenTelemetry?
OpenTelemetry is an open-source collection of tools, APIs, and SDKs that aims to standardize the way we generate and collect telemetry data. It follows a specification-driven development. The OpenTelemetry specification has design and implementation guidelines for how the instrumentation libraries should be implemented. In addition, it provides client libraries in all the major programming languages which follow the specification.
OpenTelemetry was formed after the merger of two open-source projects - OpenCensus and OpenTracing in 2019. Since then, it has been the go-to open-source standard for instrumenting cloud-native applications.
The specification is designed into distinct types of telemetry known as signals. Presently, OpenTelemetry has specifications for these three signals:
- Logs
- Metrics and
- Traces
Together these three signals form the three pillars of observability. OpenTelemetry is the bedrock for setting up an observability framework. The application code is instrumented using OpenTelemetry client libraries, which enables the generation of telemetry data. Once the telemetry data is generated and collected, OpenTelemetry needs a backend analysis tool to which it can send the data.
OpenTelemetry can send to multiple backends. You can use different backends for each signal in OpenTelemetry. But managing different tools is not recommended. Engineering teams also need to correlate all signals for effective analysis. And that’s where an APM tool is needed.
Things to keep in mind while choosing an OpenTelemetry APM
Below is the list of factors that should be taken into consideration before selecting an OpenTelemetry APM:
Support for all distinct signals of OpenTelemetry
Currently, OpenTelemetry collects telemetry data in three distinct signals, namely, logs, metrics, and traces. Setting up a robust observability framework requires the use of all three signals. An OpenTelemetry APM should be able to ingest and visualize all three signals. Moreover, the frontend of the OpenTelemetry APM should also provide features to easily correlate the signals.Native support for OpenTelemetry semantic conventions
In OpenTelemetry, every component of a distributed system is defined as an attribute. The attribute is nothing but a key-value pair. These attributes are defined by the OpenTelemetry specification as OpenTelemetry semantic conventions. For example, here is a glimpse of how HTTP conventions look like:Attribute Description Example http.method HTTP request method GET; POST; HEAD http.target The full request target as passed in an HTTP request line or equivalent /blog/june/ http.scheme The URI scheme that identifies the used protocol http; https An OpenTelemetry APM should have native support to store data with OpenTelemetry semantic conventions. Existing observability vendors usually transform the data collected using OpenTelemetry semantic conventions into their propriety formats. But OpenTelemetry has a huge list of semantic conventions which might not be fully utilized in such scenarios.
Should allow aggregates on trace data
Running aggregates on trace data enables you to create service-centric views. OpenTelemetry also provides you the ability to create custom tags. Combined with custom tags and aggregated trace data gives you a powerful magnifying glass to surface performance issues in your services. For example, you can get the error rate and 99th percentile latency ofcustomer_type: goldordeployment_version: v2orexternal_call: paypalOpen Source
OpenTelemetry is an open source standard with a huge community backing. It is testimonial to the fact that community-driven projects can solve large complex engineering problems. It is not necessary for the OpenTelemetry APM to be open source.But having an open-source OpenTelemetry APM can enable you to have a full-stack open-source solution. Open-source solutions have more flexibility, and if you self-host, you don’t need to worry about things like data privacy.
Most SaaS APMs now claim to be 100% compatible with OpenTelemetry. But it’s difficult to move away from legacy systems. A solution built natively for OpenTelemetry can be a good choice for OpenTelemetry APM. And that’s where SigNoz comes into the picture.
SigNoz - An APM built natively for OpenTelemetry
SigNoz is a full-stack open source APM built natively to support OpenTelemetry. At SigNoz, we believe that OpenTelemetry is going to be the world standard for instrumenting cloud-native applications.
SigNoz supports OpenTelemetry semantic conventions and provides visualization for all three distinct types of signals(log management is under active development) supported by OpenTelemetry.
The steps to send telemetry data to SigNoz involves:
- Instrument application code with language-specific OpenTelemetry libraries
- Configure OpenTelemetry Exporters to send data to SigNoz
- Visualize and analyze telemetry data using SigNoz dashboards
Here’s a picture depicting how OpenTelemetry fits within an application and SigNoz.
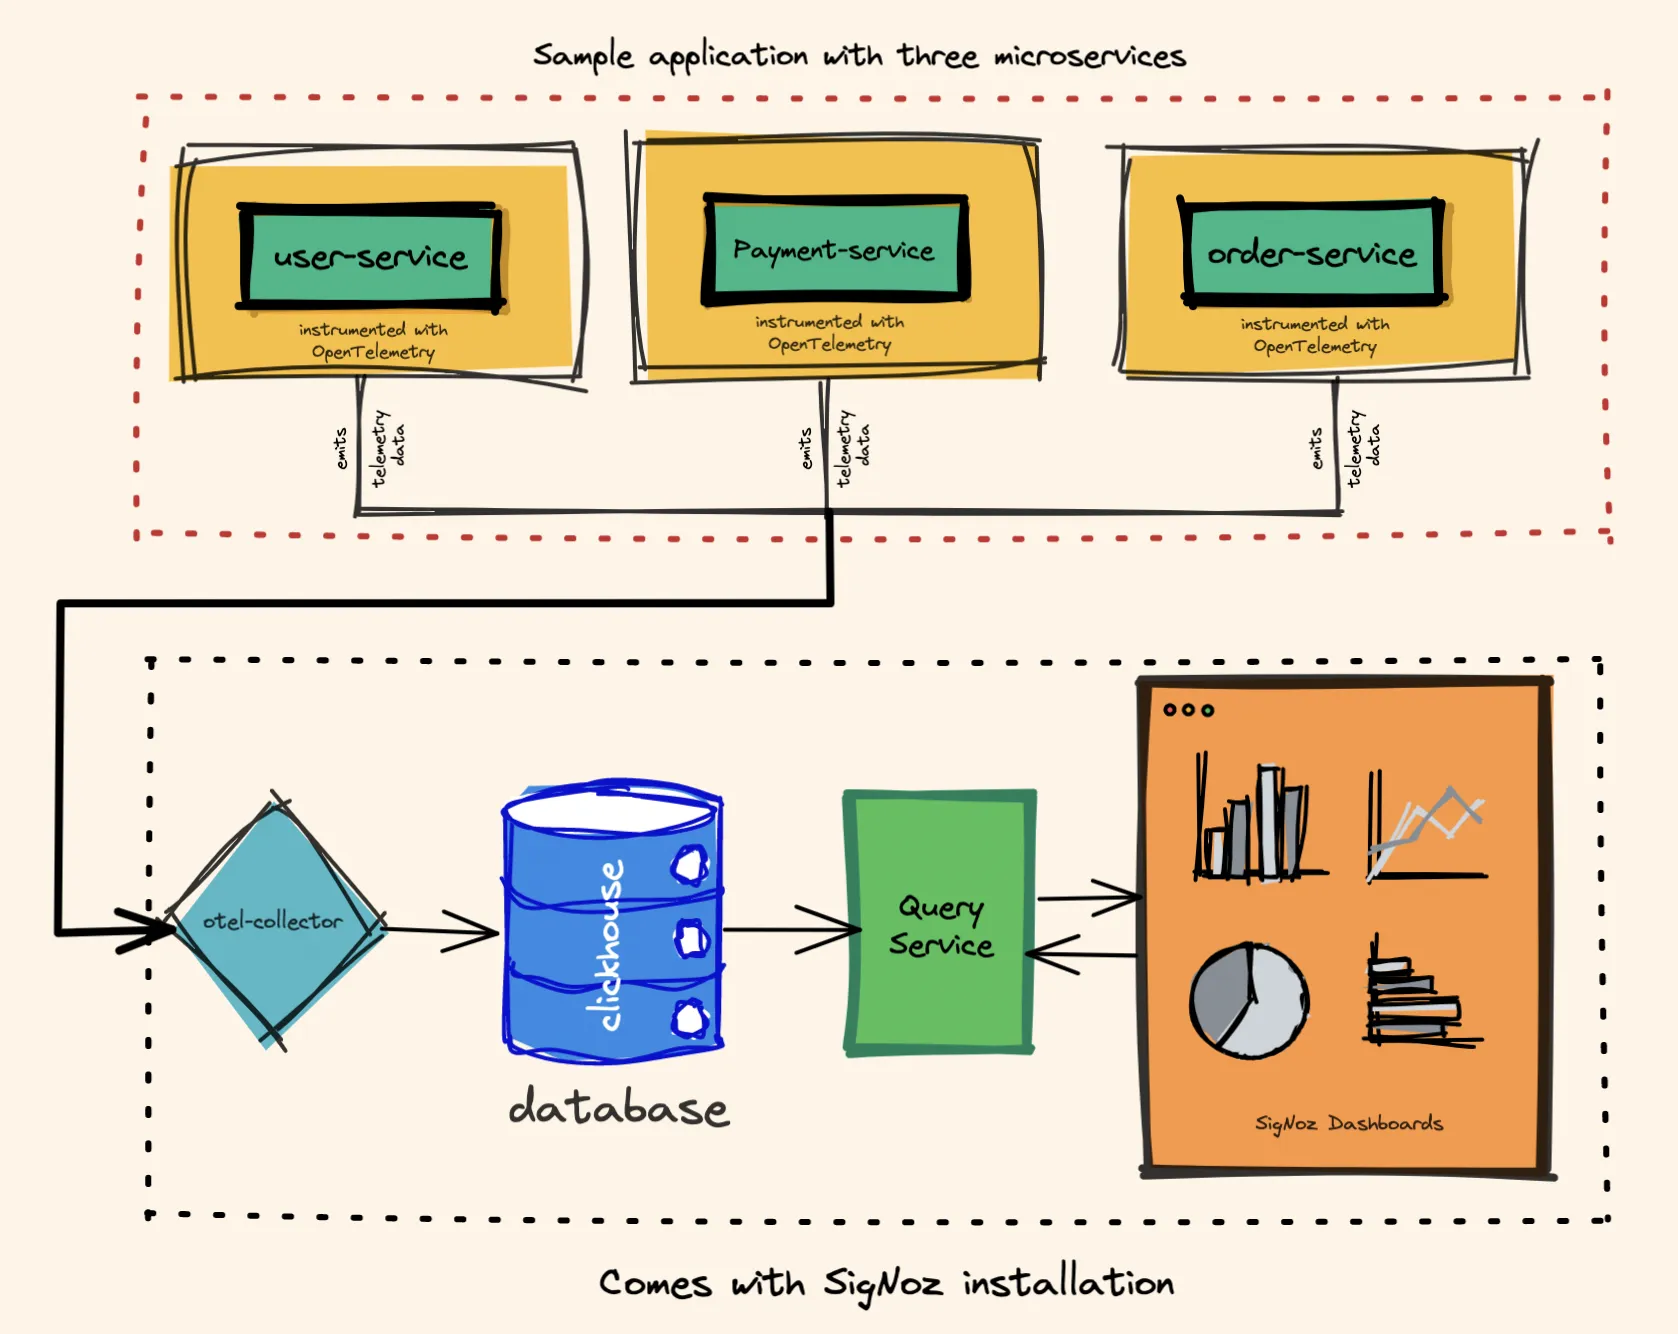
It is easy to get started with SigNoz. It can be installed on macOS or Linux computers in just three steps by using a simple installation script.
The install script automatically installs Docker Engine on Linux. However, you must manually install Docker Engine on macOS before running the install script.
git clone -b main https://github.com/SigNoz/signoz.git
cd signoz/deploy/
./install.sh
You can visit our documentation for instructions on how to install SigNoz using Docker Swarm and Helm Charts.
Once your application is instrumented with OpenTelemetry client libraries, the data can be sent to SigNoz by specifying a specific port on the machine where SigNoz is installed.
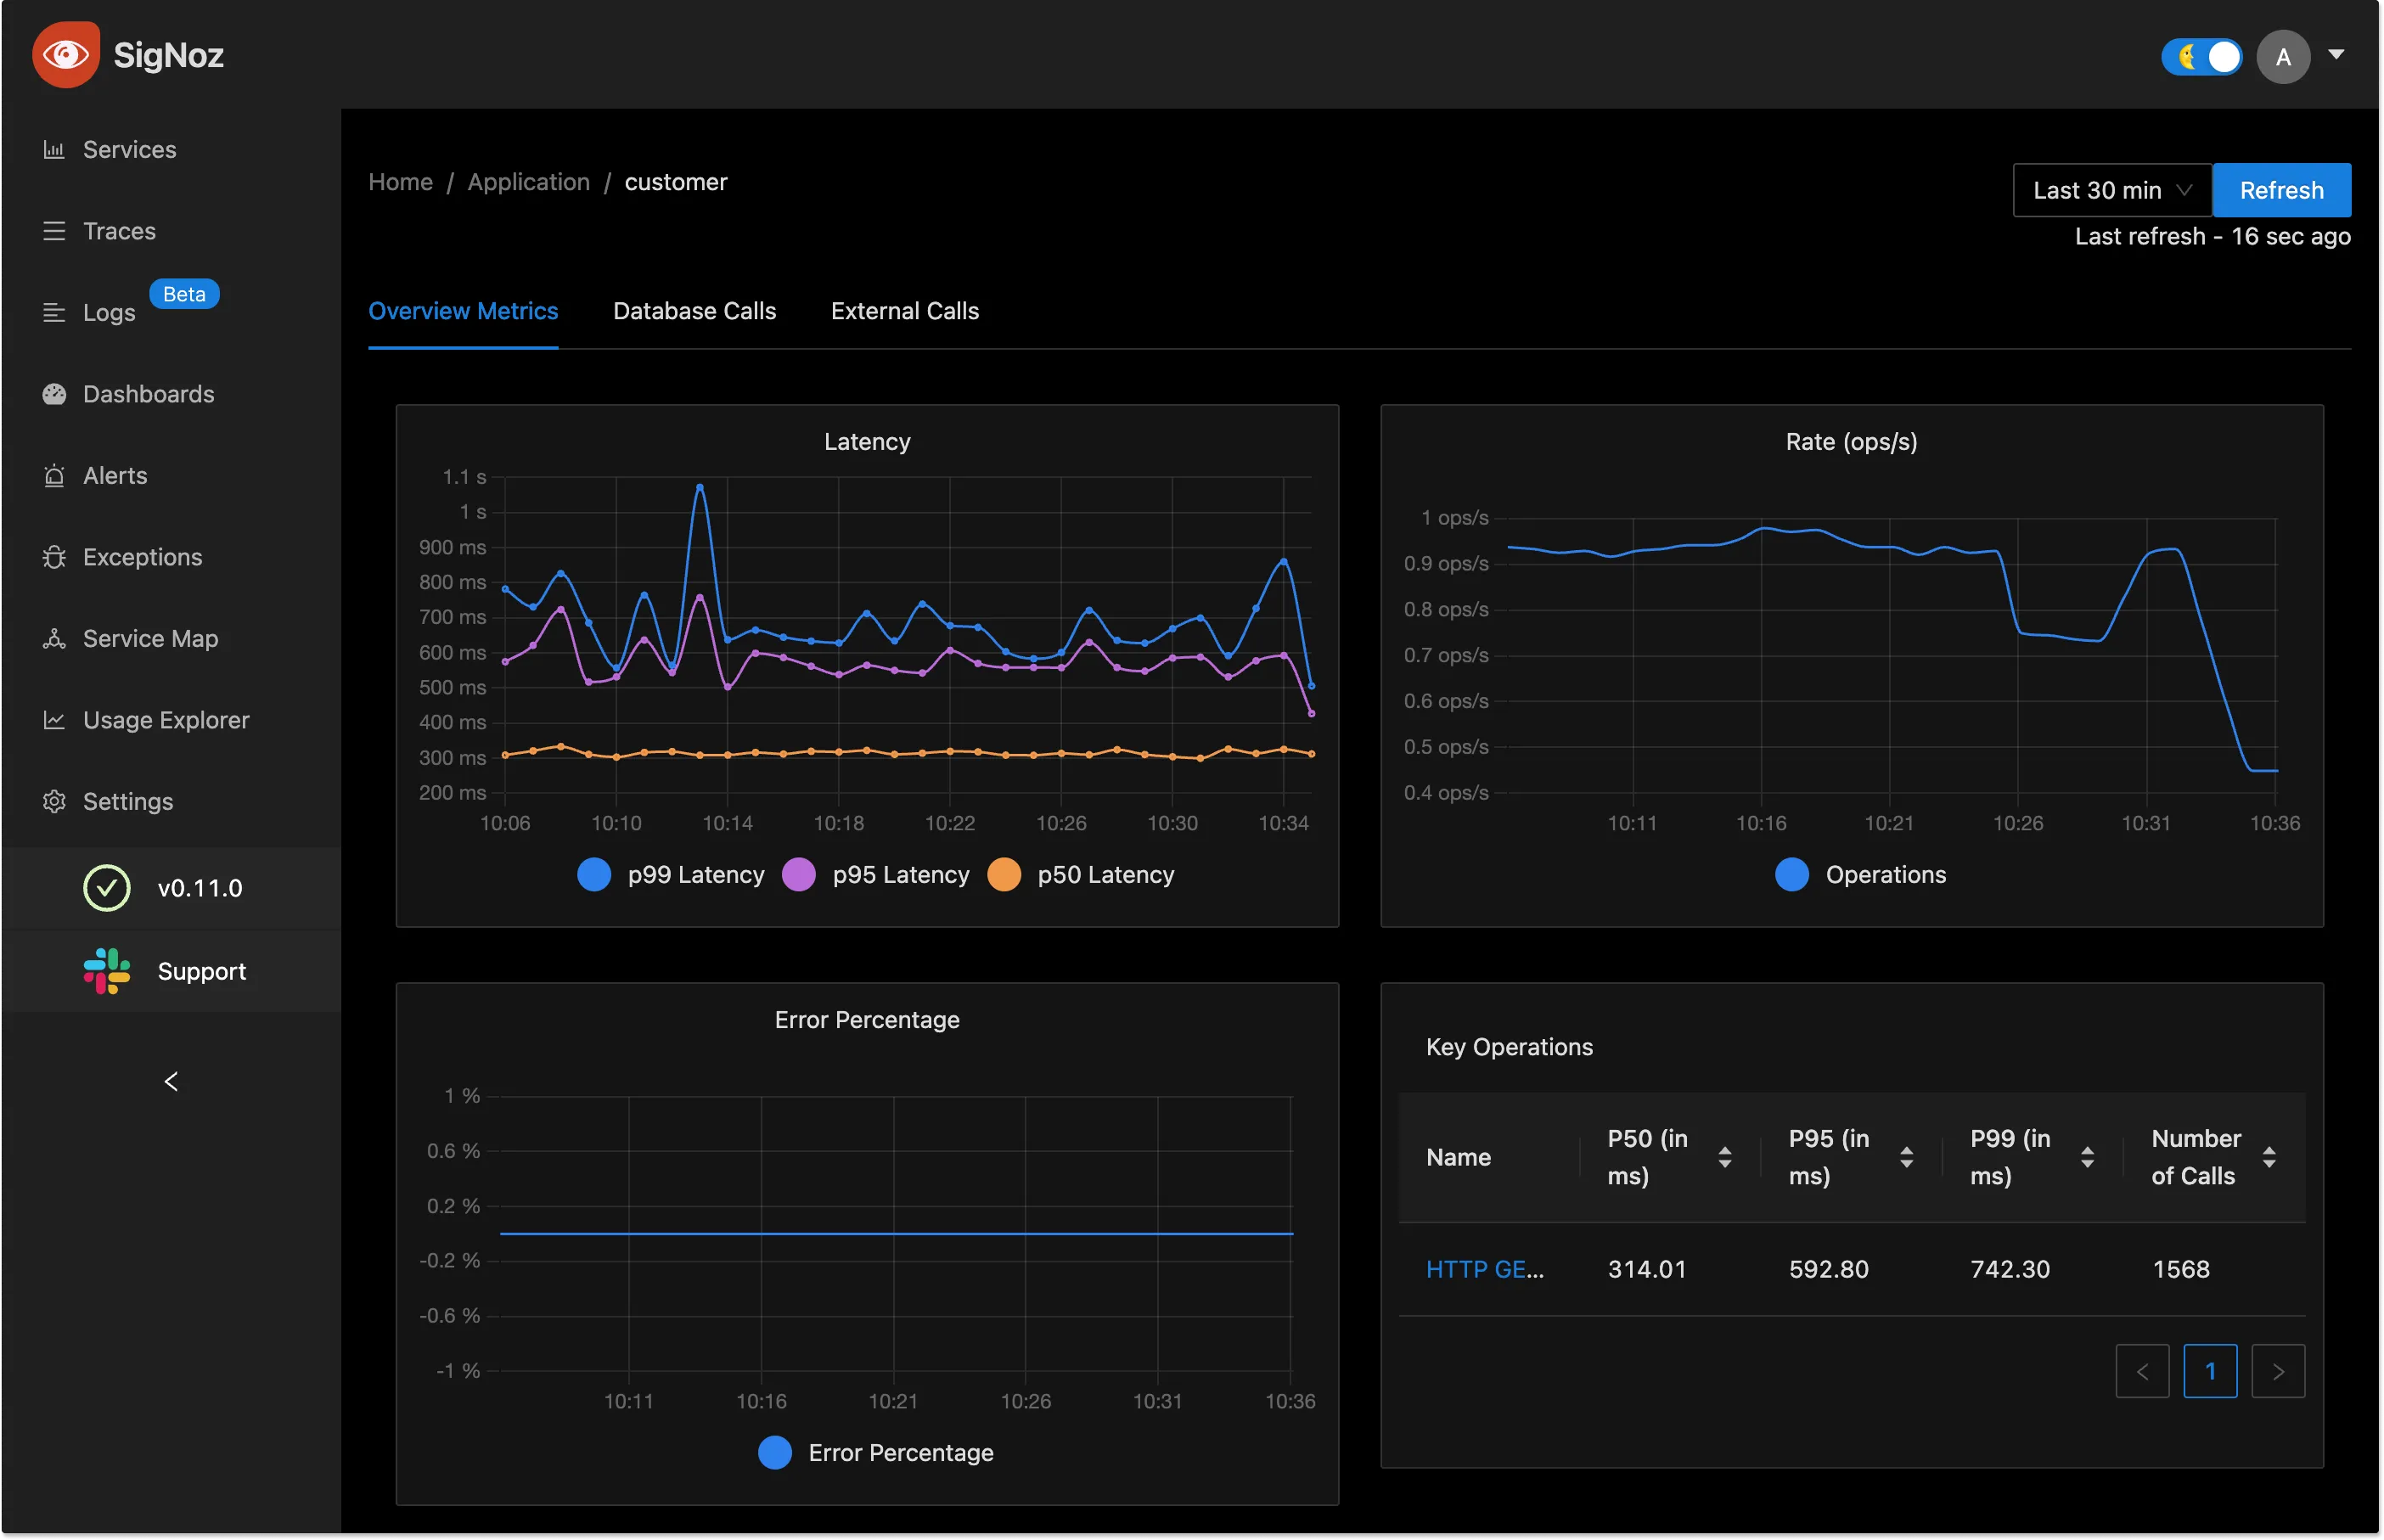
You can then use Signoz to monitor application metrics with out-of-box charts and visualization.
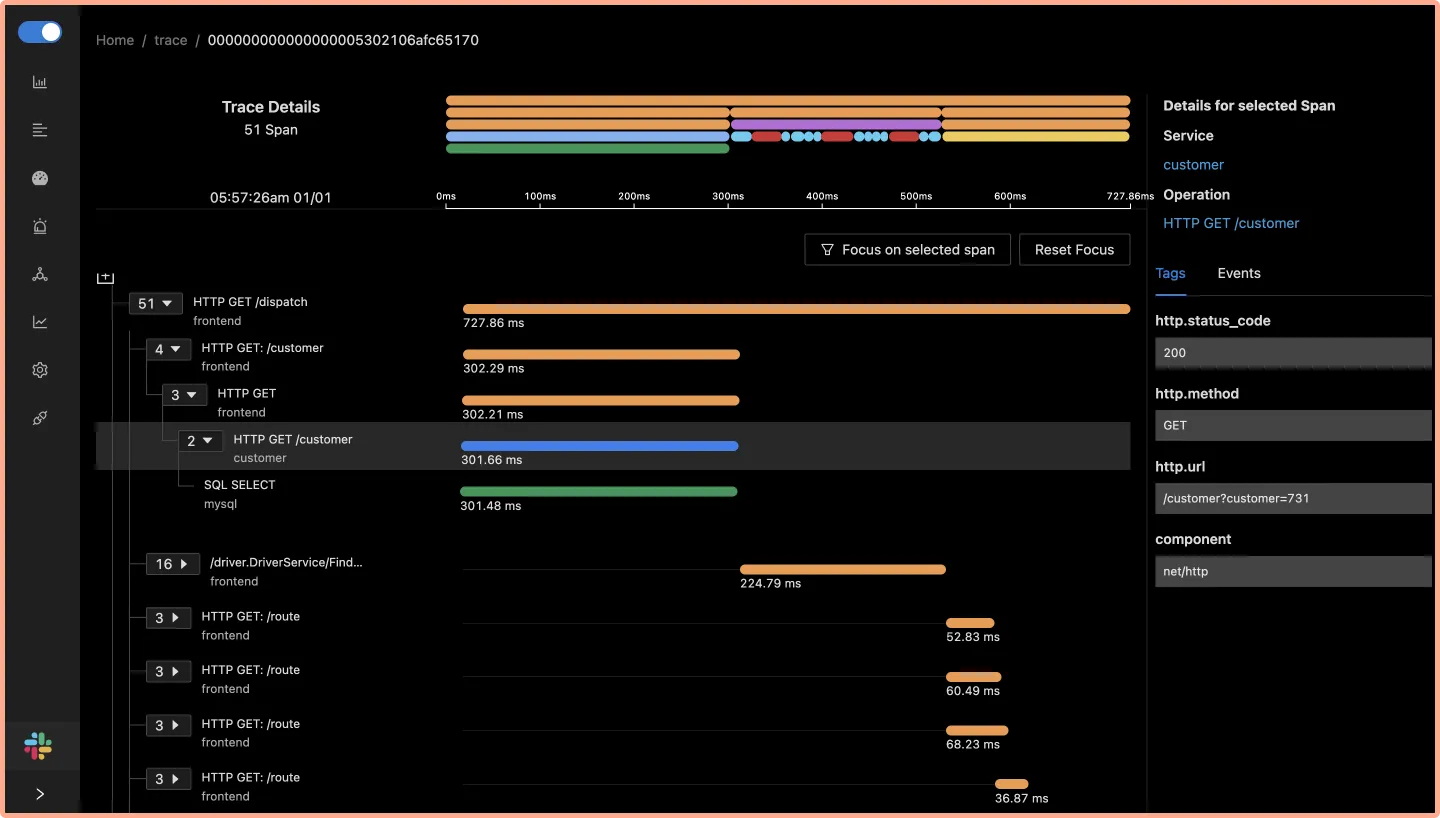
The tracing signal from OpenTelemetry instrumentation helps you correlate events across services. With SigNoz, you can visualize your tracing data using Flamegraphs and Gantt charts. It shows you a complete breakdown of the request along with every bit of data collected with OpenTelemetry semantic conventions.
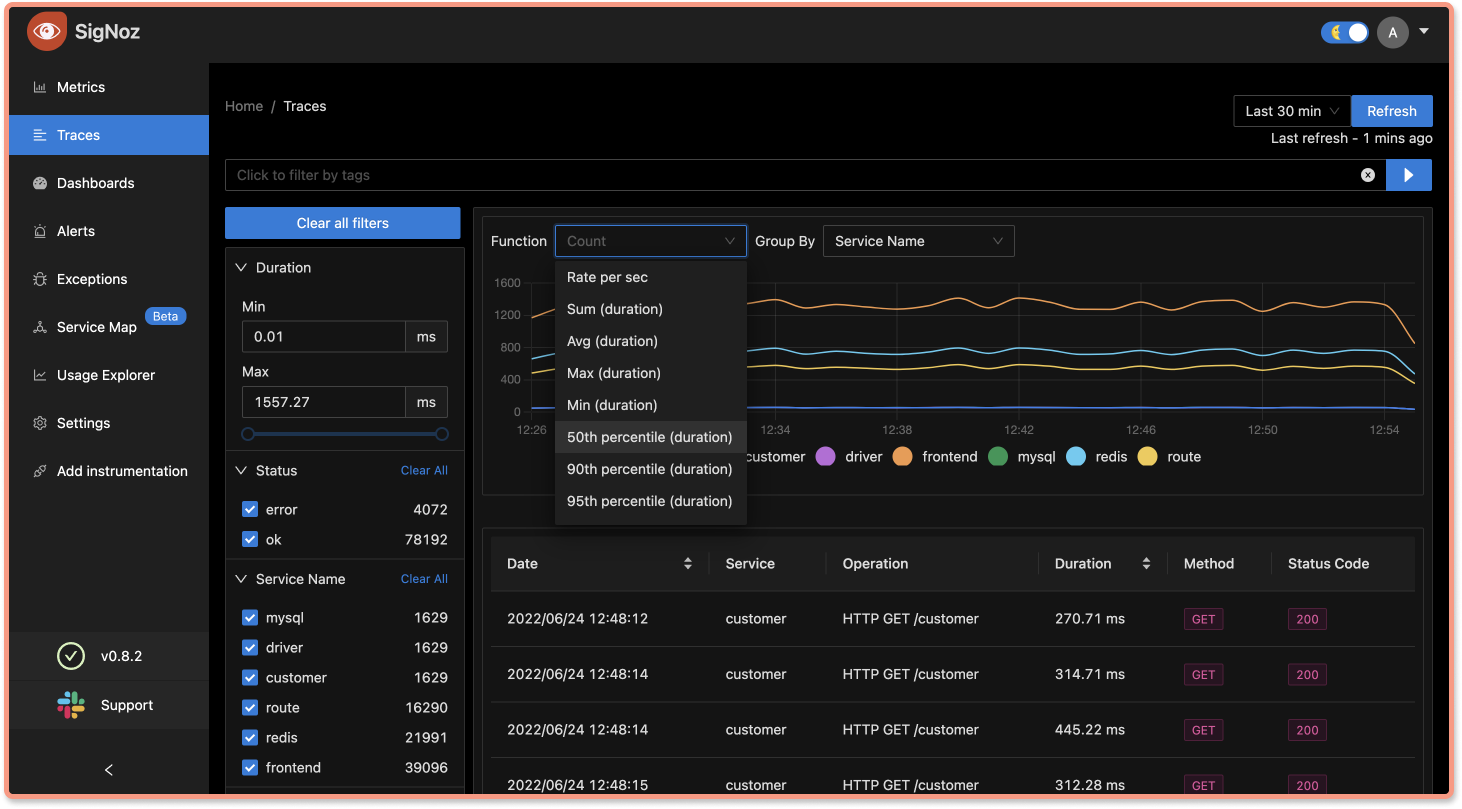
SigNoz also lets you run aggregates on your tracing data. Running aggregates on tracing data enables you to create service-centric views, providing insights to debug applications at the service level. It also makes sense for engineering teams as they own specific microservices.
You can check out the SigNoz GitHub repo here:


