In microservices architecture, observability tools enable you to create central dashboards to gauge the health of your distributed systems. Let's explore some top observability tools which can help you in meeting the increasing demands of today's users.
In today's digital economy, distributed architectures have become the norm. Organizations are also opting for polyglot microservices to boost developer productivity. But how do you manage the operational challenges of such systems? Customer experience is the key to the success of tech companies of any size, be it startups, mid or large-level enterprises. You need to proactively solve for things like availability and performance of your applications in production. And that's where observability comes into the picture. A robust observability framework is now critical for maintaining your systems in fine health. Observability is powered by telemetry data - a combination of logs, metrics, and traces.
A good observability tool has many components:
It should enable you to generate, sample, process, and emit telemetry data.
It should have a good storage system for fast retrieval and long-term retention.
It should have a good visualization layer for your teams to consume and take action.
In this article, let's explore the top 9 observability tools in 2022 which can be perfect for your microservice application.
List of Top 9 observability tools in 2022
- SigNoz
- Instana
- Dynatrace
- Grafana Labs
- Honeycomb
- Lightstep
- New Relic
- Datadog
- Splunk
Top observability tools in 2022
Now let's explore the top observability tools in 2022.
SigNoz
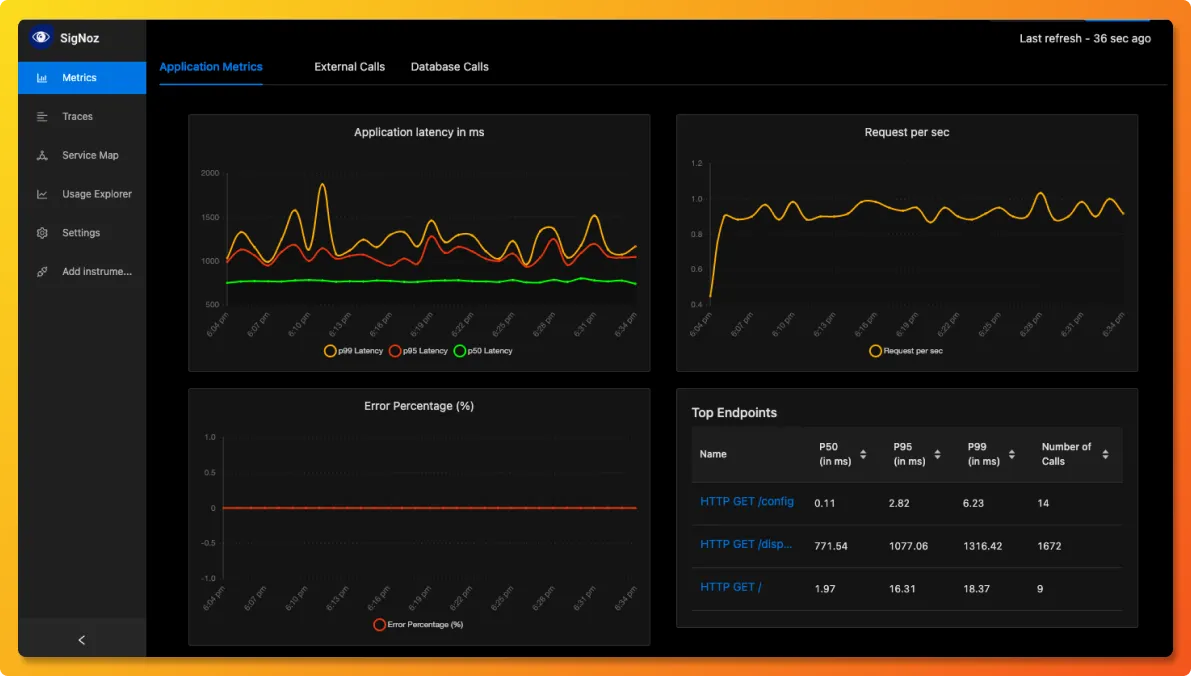
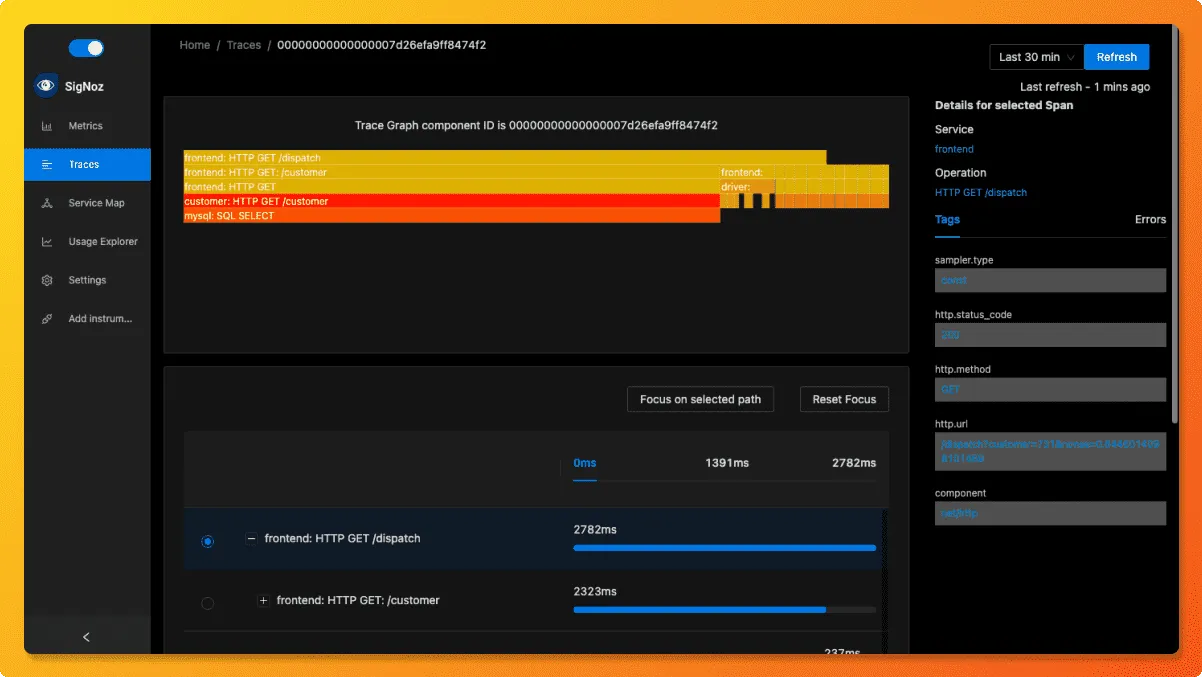
SigNoz is a full-stack open-source APM and observability tool. It captures both metrics and traces with log management currently in the product roadmap. One of the advantages of SigNoz is that it is open-source, so you are not locked in with a SaaS vendor. It can also be hosted within your infra. As such, you don't need to send your data to any third party.
SigNoz enables a full-stack observability stack for your microservice application. Let's see what does a full-stack observability tool entails:
- Generation of telemetry data(logs, metrics & traces)
- A storage backend to store the telemetry data, which is often huge
- A visualization layer for your engineering teams to consume and take actions
SigNoz uses OpenTelemetry - a vendor-agnostic instrumentation library for generating telemetry data. OpenTelemetry is a project under Cloud Native Computing Foundation and is becoming the industry standard for creating portable telemetry data.
Instana
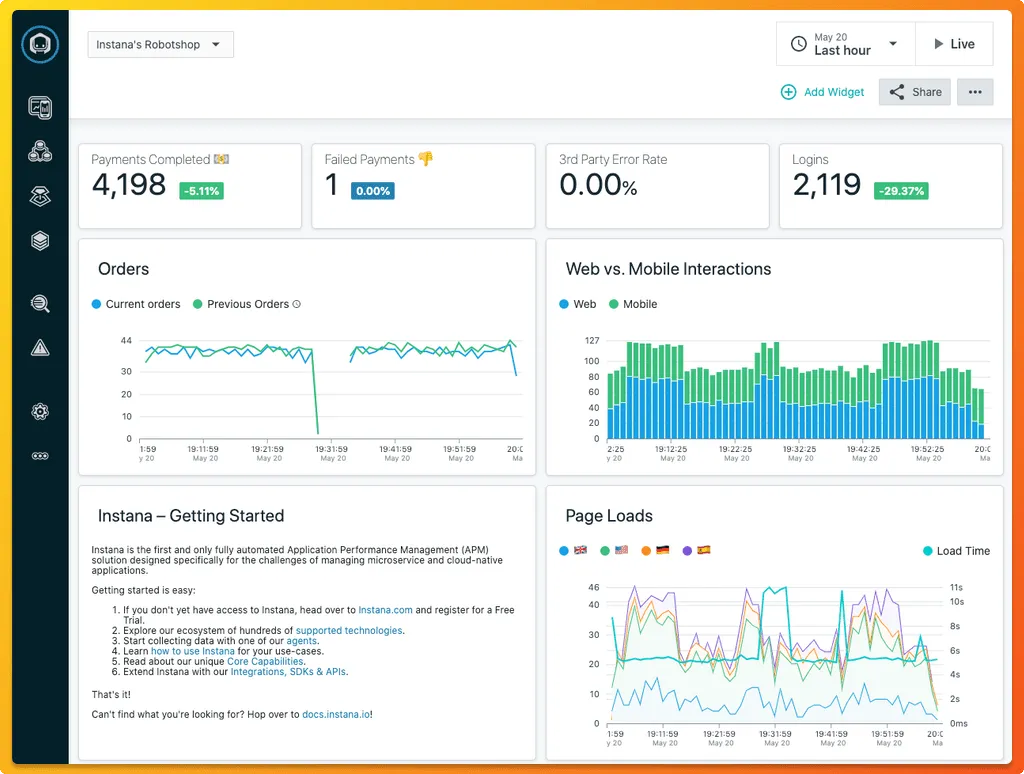
Instana is enterprise observability and automated application monitoring tool. It uses an agent to discover and monitor components. This agent needs to be installed on every host that is to be monitored.The agents deploy sensors crafted to capture data from different technologies. Sensors automatically collect configuration, changes, metrics, and events.
Instana charges $75 per host/per month if billed annually. It also supports open standards like Prometheus, StatsD, OpenTracing, and Opencensus.
Dynatrace
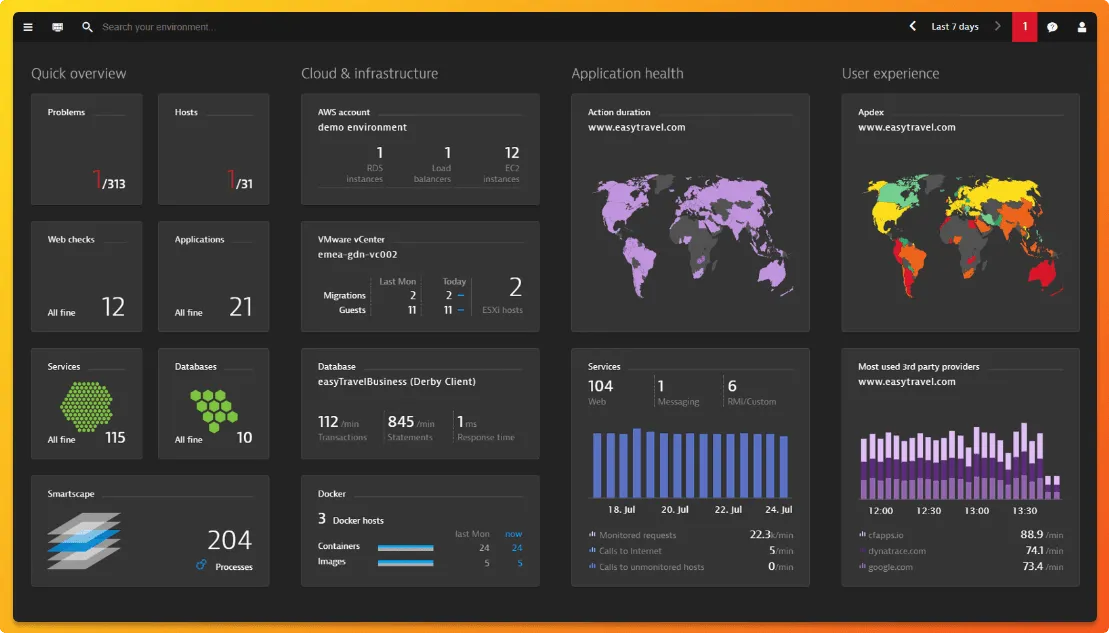
Dynatrace is an extensive SaaS enterprise tool targeting a broad spectrum of monitoring needs of large-scale enterprises. It provides an AI engine called Davis to automate things like root cause analysis and anomaly detection.Dynatrace also provides a different solution for infrastructure monitoring, application security, and cloud automation. The pricing depends on the product you want to opt for.
Full-stack monitoring, the product aimed to provide observability for apps, is priced at $69 per month for 8 GB per host if billed annually.
Grafana Labs
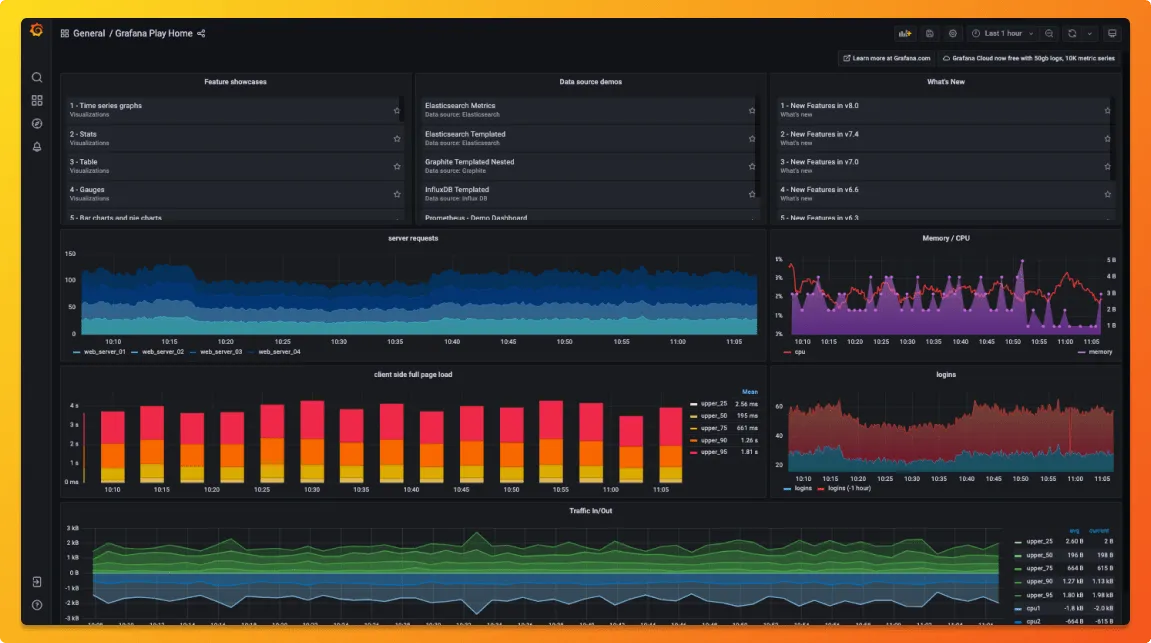
Grafana is popular open-source analytics and interactive visualization web layer. It supports many different storage backends for time-series data. It can be connected to data sources like Graphite, InfluxDB, ElasticSearch, Prometheus, and many more. For traces, it supports Jaeger, Tempo, X-Ray, and Zipkin data sources.Grafana offers plugins, dashboards, alerts, and different user-level access for governance as an observability tool. In addition, it provides two versions of services:
Grafana cloud - You can send your data to Grafana cloud dashboards. It provides solutions such as Grafana Cloud Logs, Grafana Cloud Metrics, and Grafana Cloud Traces.
Grafana Enterprise stack - It provides support for metrics and logs with Grafana installed within your infrastructure. It also comes with expert support.
Honeycomb
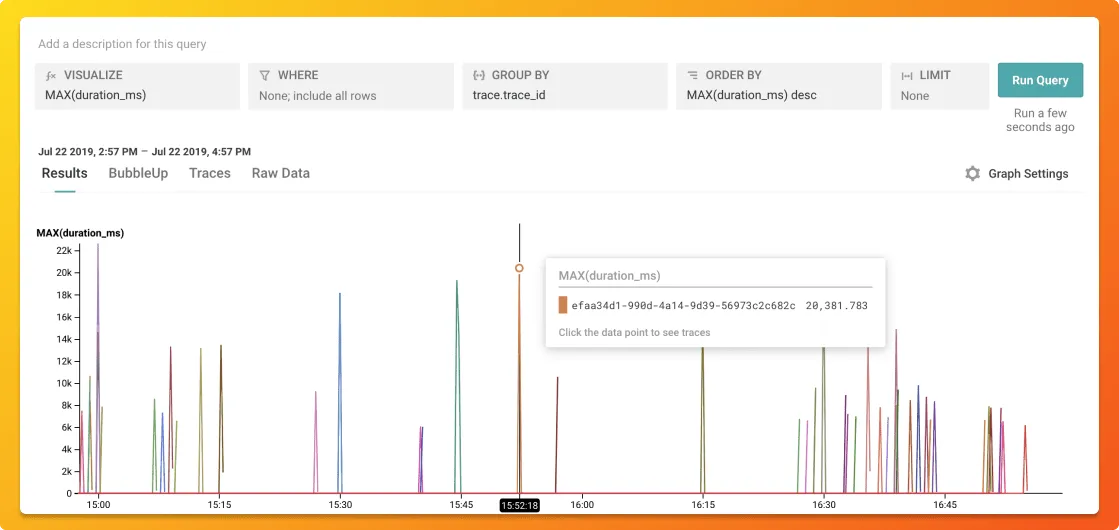
Honeycomb is an observability tool that aims to provide the visibility needed by engineering teams to troubleshoot problems in distributed systems. It is a full-stack cloud-based observability tool with support for events, logs, and traces.If your code is not already instrumented, Honeycomb provides an automatic instrumentation agent called Honeycomb beelines, which can instrument your code. It also supports OpenTelemetry for generating instrumentation data.
Honeycomb offers a free tier of service, and its pro tier starts at $100. The pricing is based on data retention and event volume captured.
Lightstep
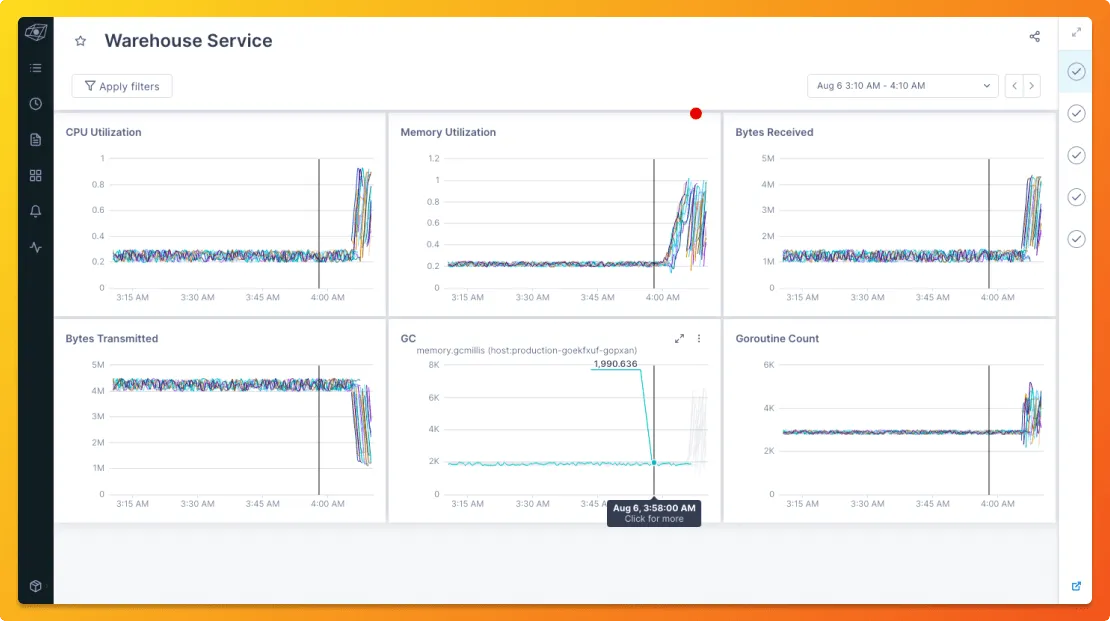
As an observability tool, Lightstep automatically detects changes to your application, infrastructure, and user experience. It can then highlight the specific causes for the changes.
For instrumentation, Lightstep uses OpenTelemetry to generate and send telemetry data to what it calls Lightstep Microsatellites. The microsatellites collect and forward the data to Lightstep SaaS for analysis. Lightstep also has its own time-series database to store the telemetry data.
The observability platform provided by Lightstep analyzes the data, builds traces, and creates service diagrams to monitor any change in performance.
Lightstep offers three plans of service:
- Community edition - Free version to help you get started.
- Teams edition - Starts at $100 per month and is based on the number of monthly active services.
- Enterprise edition - Offered to large enterprises with discounts based on volume.
New Relic
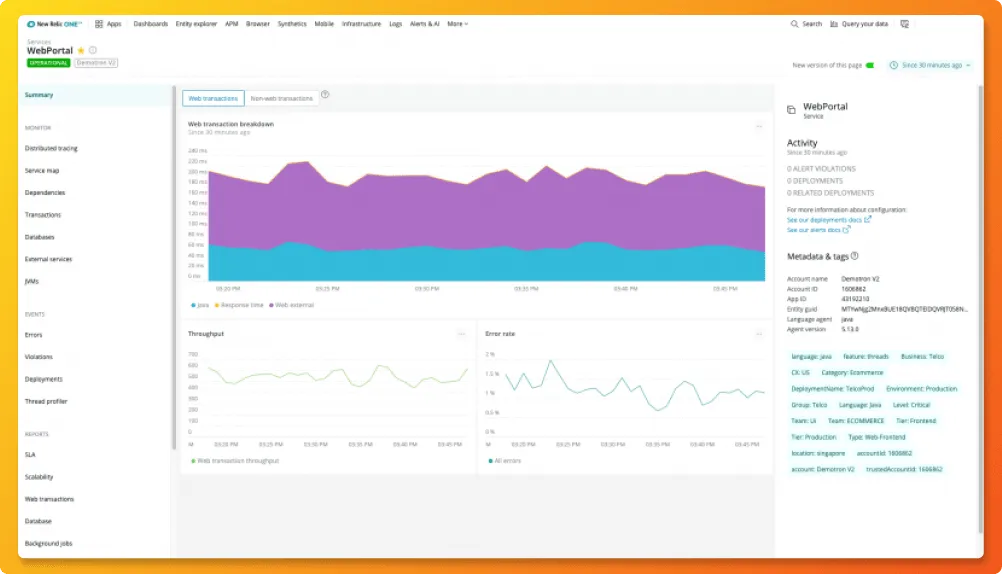
New Relic is one of the oldest companies in the observability domain. Its observability tool enables you to visualize, analyze and troubleshoot your software stack in one platform. It also supports auto-instrumentation for eight popular programming languages.New Relic can connect your application performance with your infrastructure health to provide you better insights for quick troubleshooting.
Standard offering includes plans for teams up to 5 full users. Their pricing depends on the amount of data ingested with 100 GB free data ingest and $0.25 per extra GB.
DataDog
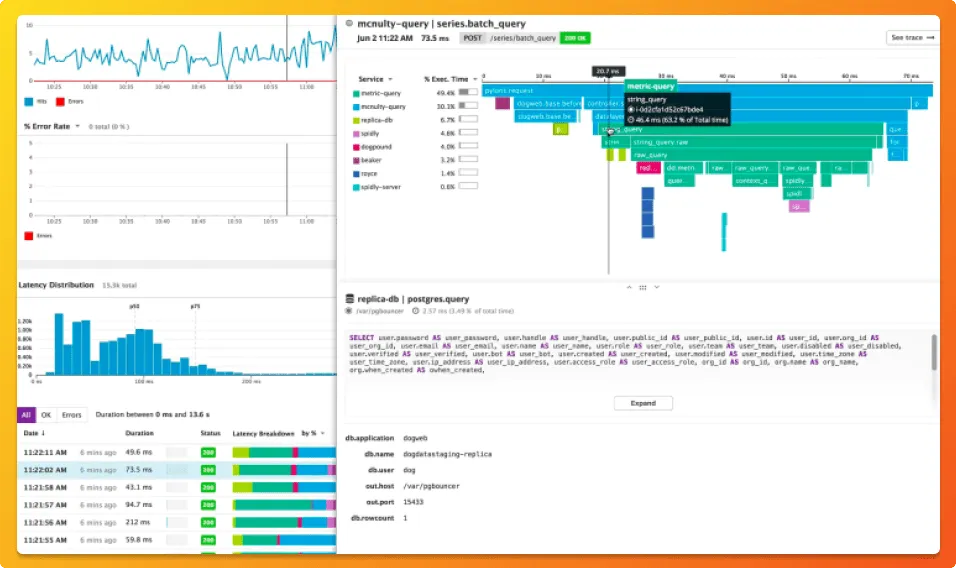
With the DataDog observability tool, you can do a range of things like infrastructure monitoring, log management, application performance monitoring, and security monitoring. For providing full visibility into distributed applications, DataDog allows you to:
- Trace requests from end to end across distributed systems
- Charts of latency percentiles(p95, p99, etc.)
- Instrumentation with open-source libraries
- seamless navigation between logs, metrics, and traces
The pricing depends on the product you opt for. For example, the APM solution provides end-to-end distributed tracing, starts at $31 per host per month if billed annually.
Splunk
Splunk is a comprehensive observability tool that offers multiple products, including:- infrastructure monitoring
- Application performance monitoring
- Log Observer
- Real User monitoring
- Synthetic monitoring, and
- Incident response management
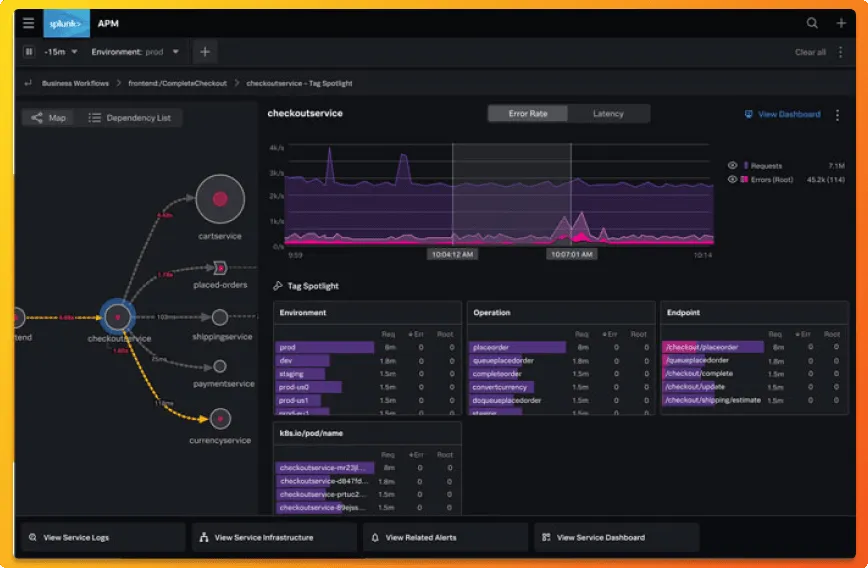
Splunk allows you to collect all traces instead of a sample set. It also provides service maps to offer DevOps teams visibility into interactions between different services, dependencies, and performance.
Splunk's observability Cloud for Enterprise editions starts at $95 per host per month if billed annually.
How to choose the right observability tool?
For applications with microservices architecture, observability tools have become critical to meet operational challenges at scale. Without observability, it is almost impossible for your engineering teams to troubleshoot bugs and assess the performance of your applications. Hence choosing the right observability tool for your application is important. A few questions to ask yourself before selecting an observability tool are as follows:
- Are there any privacy laws that you need to take care of while sharing user's data with a third-party tool?
- Does the pricing suit your budget?
- How easy is it to get started with things like instrumentation?
- How much data do you want to retain?
- Does the tool provide seamless integration between metrics, logs, and traces?
An open-source tool like SigNoz, can be your best option in today's privacy-driven digital economy. Moreover, SigNoz uses open-source standards for instrumentation, and its code can be assessed for quality from its GitHub repo. Finally, as the tool is open-sourced, you get the support of the community while having access to out-of-box features like a SaaS vendor.
Getting started with SigNoz
You can get started with SigNoz using just three commands at your terminal.
git clone -b main https://github.com/SigNoz/signoz.git
cd signoz/deploy/
./install.sh
For detailed instructions, you can visit our documentation.
You can check out SigNoz's GitHub repo here 👇


