Kubernetes monitoring is a critical process for keeping your Kubernetes clusters running in fine health. In this tutorial, we will learn everything about Kubernetes monitoring. We will be using two open-source tools: OpenTelemetry and SigNoz, to monitor a Kubernetes cluster, so you can follow along with the tutorial easily.

Containerization technologies like Docker and Kubernetes have solved many engineering problems like on-demand scaling and deploying new applications, but it also brings a lot of operational complexity. Modern distributed applications deployed using Kubernetes have too many moving parts, and cluster operators need a monitoring tool to run their clusters effectively.
In this tutorial, we will be using open-source tools: OpenTelemetry and SigNoz, to monitor a Kubernetes cluster. With open-source tools, you are more in control of your data. Furthermore, if there are privacy laws, you can deploy the tools on-prem so that there is no need to send the data to any cloud vendor.
Why monitor your Kubernetes cluster?
Kubernetes makes it easy to deploy and operate applications in a microservice architecture. However, as the number of microservices increases, your Kubernetes cluster also becomes quite complex to manage. Cluster operators need to take care of a lot of things like running the desired number of pods, utilization of cluster resources, and misconfigurations.
Monitoring tools can help cluster operators proactively manage their clusters by reporting on critical metrics. But traditional monitoring tools are often inadequate to monitor the dynamic environment of a Kubernetes cluster.
Modern monitoring tools should enable engineering teams to set up an observability framework for their infrastructure, including Kubernetes clusters. Observability is a term from control theory, which states that a system is observable if the internal states of the system can be determined by examining its output.
For observability in computing systems, these output signals are commonly divided into three major categories - logs, metrics, and traces. OpenTelemetry is an instrumentation layer for cloud-native applications that aims to generate and collect these output signals.
Before we deep-dive into the tutorial for Kubernetes monitoring, let’s have a brief overview of OpenTelemetry and SigNoz.
What is OpenTelemetry?
OpenTelemetry, also known as OTel for short, is an open-source vendor-agnostic set of tools, APIs, and SDKs used to instrument applications to create and manage telemetry data(metrics, traces, and logs). It is backed by Cloud Native Computing Foundation, the same foundation under which Kubernetes graduated.OpenTelemetry aims to make telemetry data a built-in feature of cloud-native software applications. The telemetry data is then sent to a backend analysis tool for storage and visualization. OpenTelemetry can be used to generate metrics from Kubernetes clusters.
OpenTelemetry is the bedrock for setting up an observability framework. It is backed by a huge community, and it is quietly becoming the world standard for instrumentation of cloud-native applications. It also provides you the freedom to choose a backend analysis tool of your choice. And that’s where SigNoz comes into the picture.
OpenTelemetry and SigNoz
In this article, we will use SigNoz, a full-stack open-source application monitoring and observability platform that can be used for storing and visualizing the telemetry data collected with OpenTelemetry. It is built natively on OpenTelemetry and works on the various data formats: OTLP, Zipkin, Jaeger, Prometheus backends, etc.
SigNoz provides query and visualization capabilities for the end-user and comes with out-of-box charts for application metrics and traces.
OpenTelemetry and SigNoz can help you monitor important metrics from your Kubernetes cluster.
What should I monitor in Kubernetes?
Monitoring your Kubernetes cluster effectively is necessary to keep your containerized infrastructure running properly. The first step is to decide which metrics to monitor for your Kubernetes cluster. The important components that need to be monitored in a Kubernetes cluster include:
- Node-level metrics
- Pod-level metrics
- Container-level metrics
With OpenTelemetry and SigNoz, you can collect and visualize these metrics easily. Now let's get down to some action and see everything for yourself.
We will divide the tutorial into two parts:
- Installing SigNoz
- Kubernetes Infrastructure Monitoring
Installing SigNoz
First, you need to install SigNoz so that OpenTelemetry can send the collected data to it.
SigNoz can be installed on Kubernetes easily using Helm:
helm repo add signoz https://charts.signoz.io

kubectl create ns platform

helm --namespace platform install my-release signoz/signoz
You should see similar output:
NAME: my-release
LAST DEPLOYED: Mon May 23 20:34:55 2022
NAMESPACE: platform
STATUS: deployed
REVISION: 1
NOTES:
1. You have just deployed SigNoz cluster:

- frontend version: '0.8.0'
- query-service version: '0.8.0'
- alertmanager version: '0.23.0-0.1'
- otel-collector version: '0.43.0-0.1'
- otel-collector-metrics version: '0.43.0-0.1'
For detailed instructions to set up SigNoz cluster in Kubernetes, please refer to our documentation.
To port forward SigNoz UI on your local machine, run the following:
kubectl port-forward -n platform service/my-release-signoz-frontend 3301
When you are done installing SigNoz, you can access the UI at http://localhost:3301.
You can alternatively set the SigNoz Frontend service type as LoadBalancer/NodePort or use Ingress for the custom domain.
Now that you have SigNoz up and running, it’s time to set up OpenTelemetry Collectors for your Kubernetes cluster.
OpenTelemetry Collector is a component of OpenTelemetry that helps to collect, process, and export the telemetry data. You can enable sampling and export data in multiple formats using OpenTelemetry collectors.
Kubernetes Infrastructure monitoring
OpenTelemetry uses receivers to collect data in specified formats. A receiver is how data gets into the OpenTelemetry Collector. Generally, a receiver accepts data in a specified format and translates it into the internal format to be consumed by OpenTelemetry. We will use the following receivers of the OpenTelemetry collector to collect metrics from the Kubernetes cluster.
kubeletstats: Kubelet Stats Receiver pulls pod metrics from the API server on a kubelethostmetrics: Host Metrics receiver generates metrics about the host system
Steps to export Kubernetes metrics to SigNoz
Step1: Clone Otel collector repo
git clone https://github.com/SigNoz/otel-collector-k8s.git && cd otel-collector-k8s
Step2: Set up the address to SigNoz in your OTel collectors
You need to set up the address to SigNoz in your OTel collector which is collecting the k8s metrics.
If you are running SigNoz in an independent Kubernetes cluster or VM, you need to change the placeholder IPs in the following files with the IP of machine where you are hosting SigNoz.
You need to update the below section.
exporters:
   otlp:
      endpoint: "<SigNoz-Otel-Collector-Address>:4317"
      tls:
         insecure: true
If you are running SigNoz in the same Kubernetes cluster where your applications are, you have to replace the above endpoint in agent/infra-metrics.yaml and deployment/all-in-one.yaml by
my-release-signoz-otel-collector.platform.svc.cluster.local:4317
In the above code snippet:
my-releaseis the Helm release nameplatformis the namespace where SigNoz is deployed- In case of SigNoz installed in different kubernetes cluster/machine, update it to the appropriate address.
Step 3: Install OTel collectors and enable specific receivers to send metrics to SigNoz
To access metrics from kubeletstats receivers you have to:
kubectl create ns signoz-infra-metrics
kubectl -n signoz-infra-metrics apply -Rf agent
kubectl -n signoz-infra-metrics apply -Rf deployment
The output will be something like this:
namespace/signoz-infra-metrics created
daemonset.apps/otel-collector-agent created
configmap/otel-collector-agent-conf created
serviceaccount/sa-otel-agent created
clusterrole.rbac.authorization.k8s.io/sa-otel-agent-role created
clusterrolebinding.rbac.authorization.k8s.io/aoc-agent-role-binding created
configmap/otelcontribcol created
serviceaccount/otelcontribcol created
clusterrole.rbac.authorization.k8s.io/otelcontribcol created
clusterrolebinding.rbac.authorization.k8s.io/otelcontribcol created
deployment.apps/otelcontribcol created
To check pod status:
kubectl -n signoz-infra-metrics get pods
The output will be something like this:
NAME                             READY   STATUS    RESTARTS   AGE
otel-collector-agent-kkchn       1/1     Running   0          2m
otelcontribcol-6d45c844c-tk2k8   1/1     Running   0          2m
To check logs of the OTel collector agent:
export POD_NAME=$(kubectl -n signoz-infra-metrics get pods -l "component=otel-collector-agent" -o jsonpath="{.items[0].metadata.name}")

kubectl -n signoz-infra-metrics logs $POD_NAME
Output should look like this:
...
2022-05-27T19:37:14.158Z    info    service/telemetry.go:95 Setting up own telemetry...
2022-05-27T19:37:14.159Z    info    service/telemetry.go:115    Serving Prometheus metrics  {"address": ":8888", "level": "basic", "service.instance.id": "50674c90-240c-4e38-8c18-d2c2b8df1532", "service.version": "latest"}
2022-05-27T19:37:14.159Z    info    service/collector.go:229    Starting otelcol-contrib... {"Version": "0.43.0", "NumCPU": 8}
2022-05-27T19:37:14.159Z    info    service/collector.go:124    Everything is ready. Begin running and processing data.
In case of any errors in the above logs, you should not see except for the case of SigNoz being unavailable or inaccessible.
Step 4. Plot Metrics in SigNoz UI
If the previous step was a success, you should be able to plot graphs from the list of kubelet metrics, follow these instructions to create dashboards and widgets.
Monitor Kubelet Metrics with SigNoz
You can get started easily for monitoring Kubelet metrics with SigNoz. All you have to do is to import a JSON file and you will get out of box charts for your Kubelet metrics.
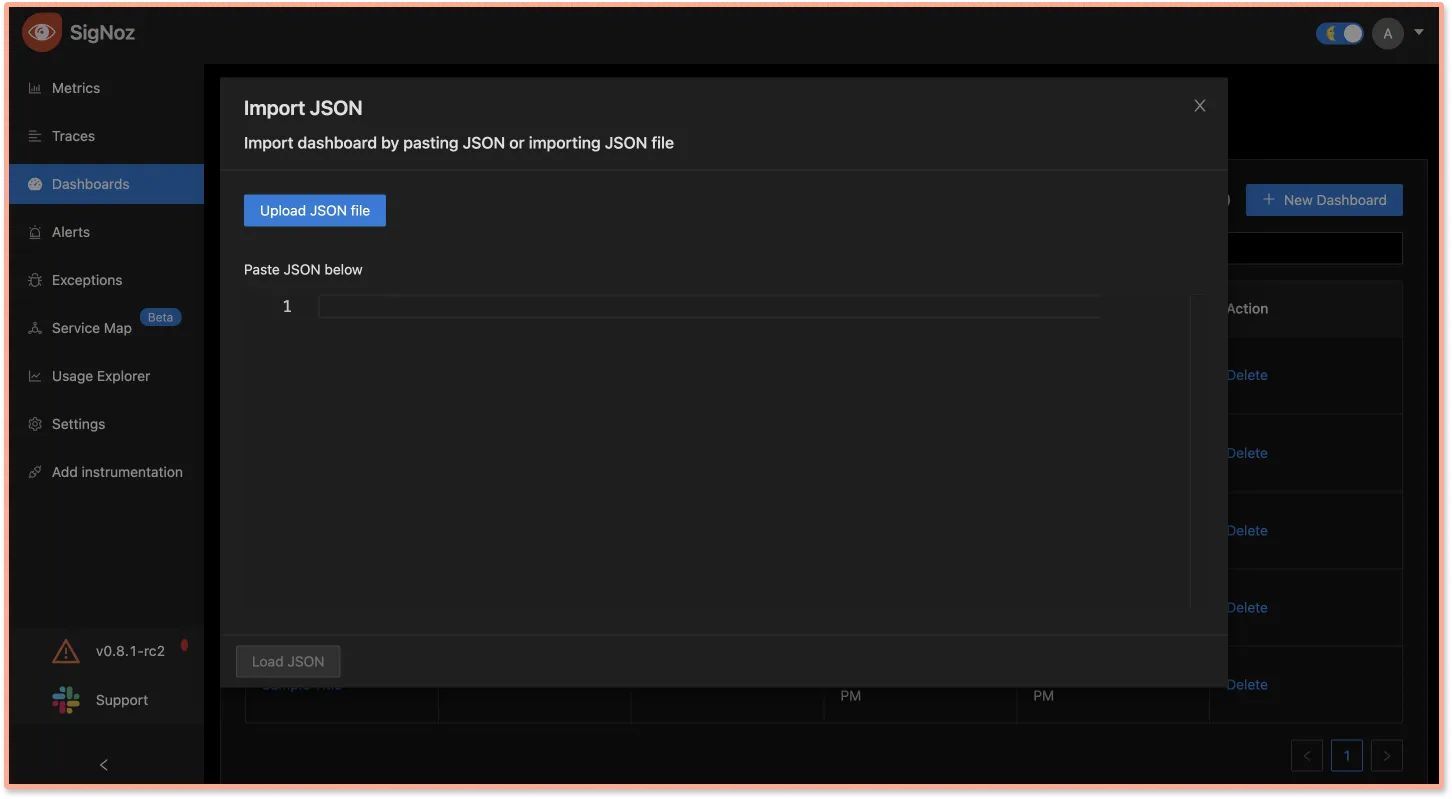
Under the Dashboards tab of SigNoz, click on + New Dashboard, and then Import JSON.

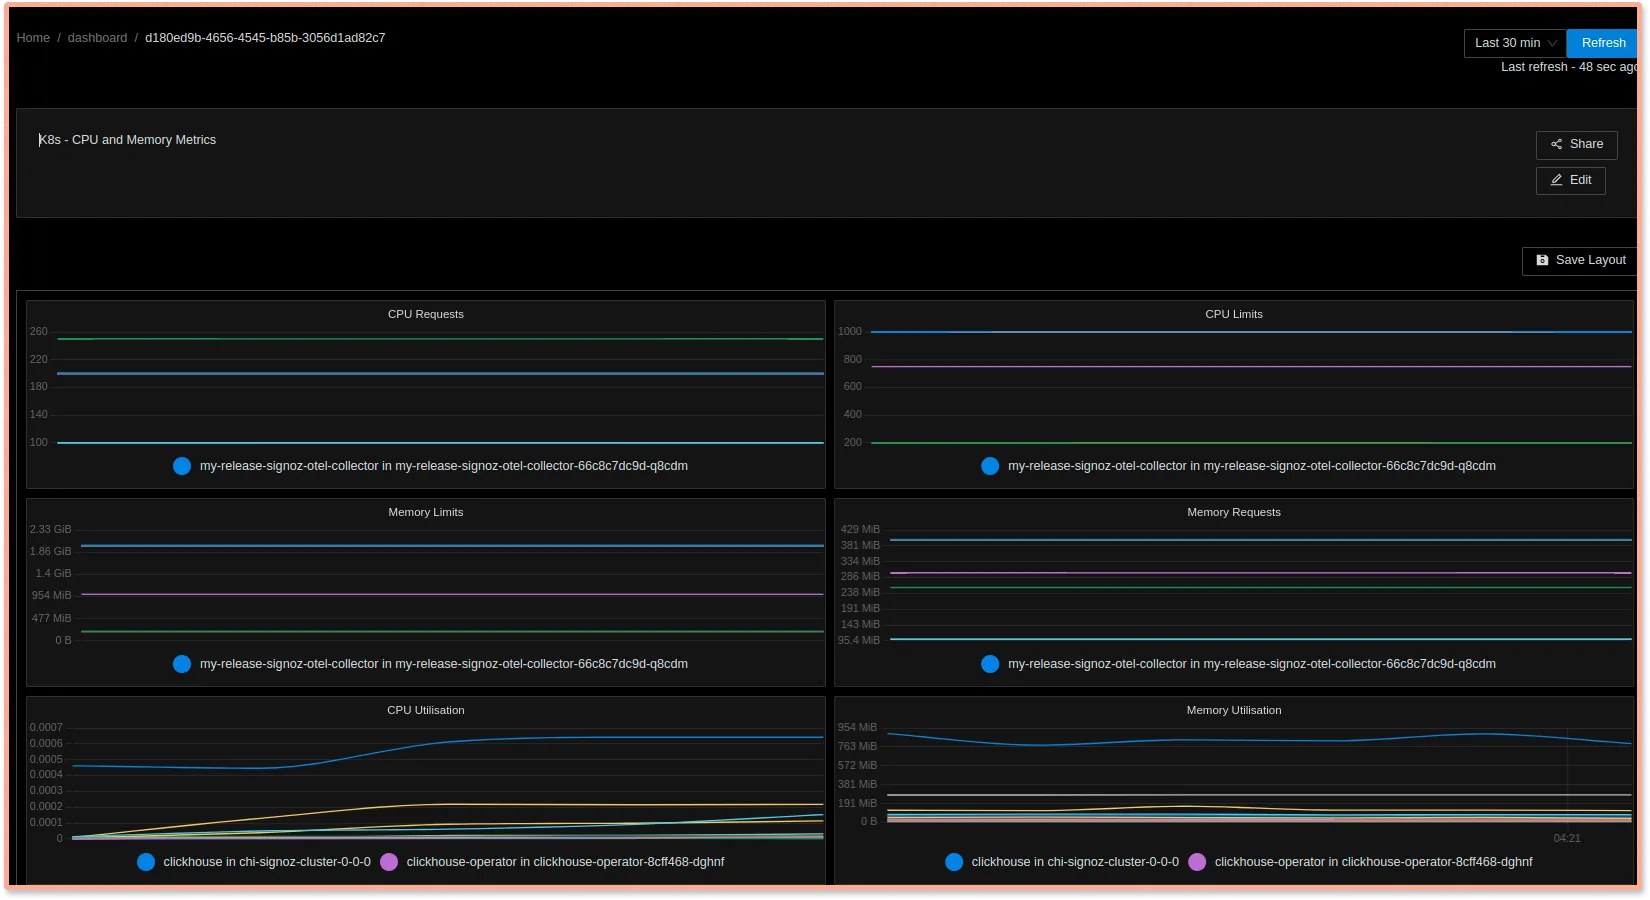
The Kubelet metrics dashboard will give you stats about CPU and memory metrics of the Kubernetes cluster.

You can include more widgets using other metrics to the dashboard as per your requirements.
Monitor Node Metrics of your Kubernetes cluster
Node metrics are very important as we have nodes underneath the abstraction of Kubernetes container orchestration.
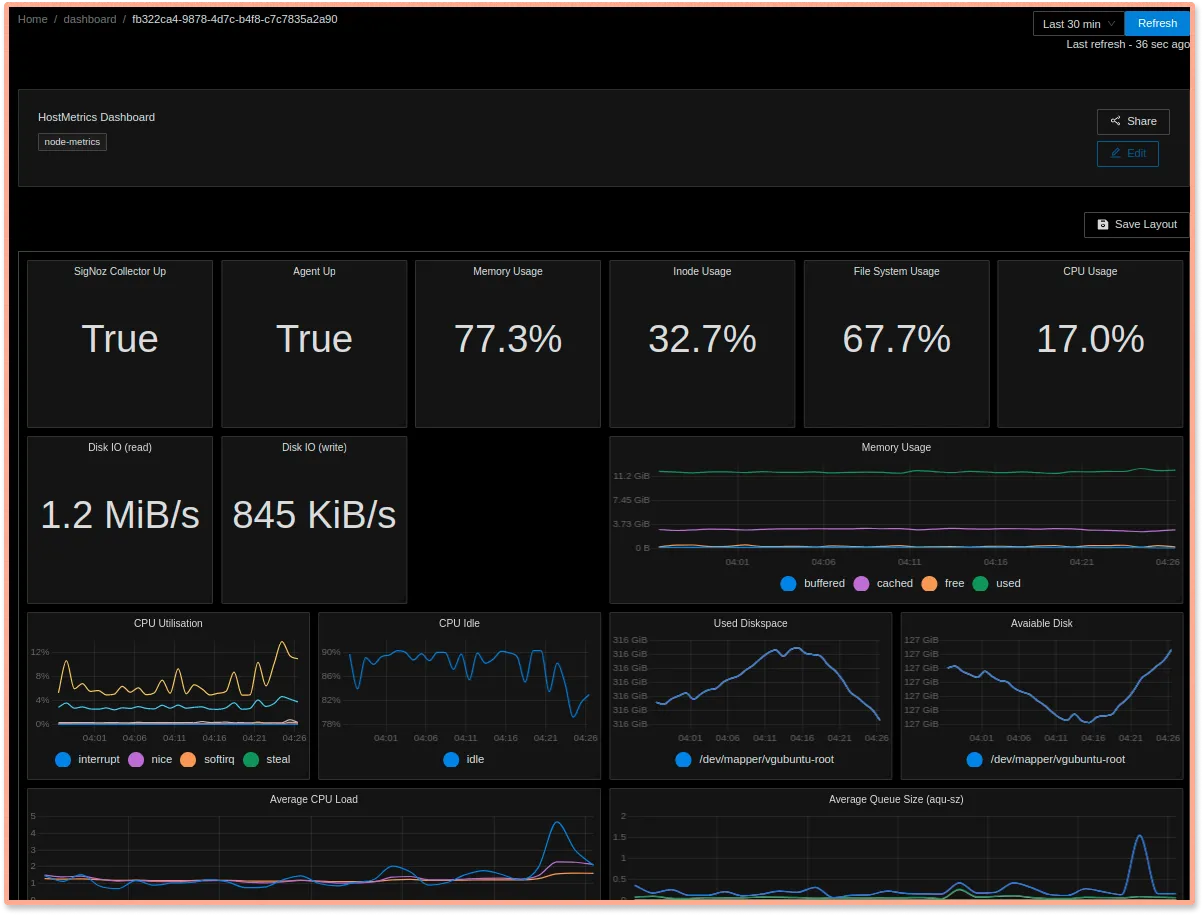
Similar to the previous section, we will be importing JSON files to create dashboards of our node metrics. We will be using the hostmetrics receiver of OTel collector to build these dashboards. There are many nodes in a Kubernetes cluster. Hence, we will be creating multiple dashboards for each node. SigNoz will add support for label widgets in the future, which would make it possible to monitor all nodes using a single dashboard.
Let's run the following commands to generate hostmetrics dashboard JSON files for each node automatically:
for node in $(kubectl get nodes -o name | sed -e "s/^node\///");
do
  curl -sL https://github.com/SigNoz/benchmark/raw/main/dashboards/hostmetrics/hostmetrics-import.sh \
    | HOSTNAME="$node" DASHBOARD_TITLE="HostMetrics Dashboard for $node" bash
done
After importing the generated dashboard JSON, you should be able to see the dashboard for your node metrics.

Conclusion
Using OpenTelemetry and SigNoz, you can set up a robust monitoring framework for your Kubernetes cluster.
OpenTelemetry is the future for setting up observability for cloud-native apps. It is backed by a huge community and covers a wide variety of technology and frameworks. Using OpenTelemetry, engineering teams can easily monitor their infrastructure and application, instrument polyglot, and distributed applications with peace of mind.
You can then use SigNoz to store and visualize your telemetry data. SigNoz is an open-source observability tool that comes with a SaaS-like experience. You can try out SigNoz by visiting its GitHub repo 👇
If you have any questions or need any help in setting things up, join our slack community and ping us in the #support channel.


