Both Grafana Tempo and Jaeger are tools aimed at distributed tracing for microservice architecture. Jaeger was released as an open-source project by Uber in 2015, while Tempo is a newer product announced in October 2020.
Jaeger is a popular open-source tool that graduated as a project from Cloud Native Computing Foundation. Grafana Tempo is a high-volume distributed tracing tool deeply integrated with other open-source tools like Prometheus and Loki.
But before we dive into the details of Jaeger and Grafana Tempo, let's take a short detour to understand distributed tracing.
What is distributed tracing?
In the world of microservices, a user request travels through hundreds of services before serving a user what they need. To make a business scalable, engineering teams are responsible for particular services with no insight into how the system performs as a whole. And that's where distributed tracing comes into the picture.
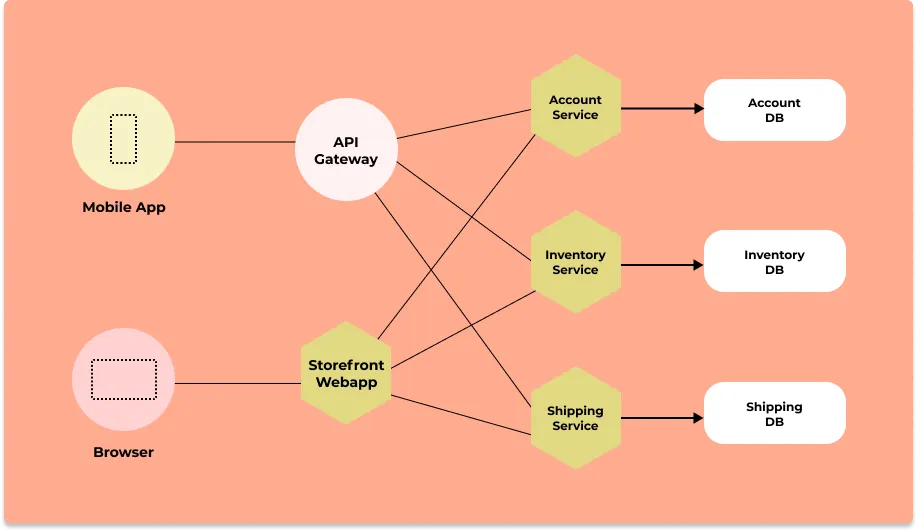
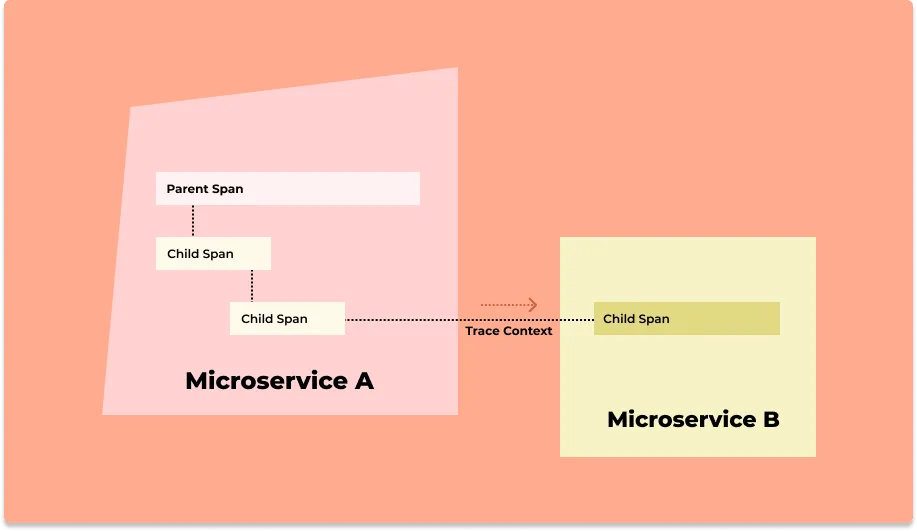
Distributed tracing gives you insight into how a particular service is performing as part of the whole in a distributed software system. There are two essential concepts involved in distributed tracing: Spans and trace context.
User requests are broken down into spans.
What are spans?
Spans represent a single operation within a trace. Thus, it represents work done by a single service which can be broken down further depending on the use case.
A trace context is passed along when requests travel between services, which tracks a user request across services. Thus, you can see how a user request performs across services and identify what exactly needs your attention without manually shifting through multiple dashboards.
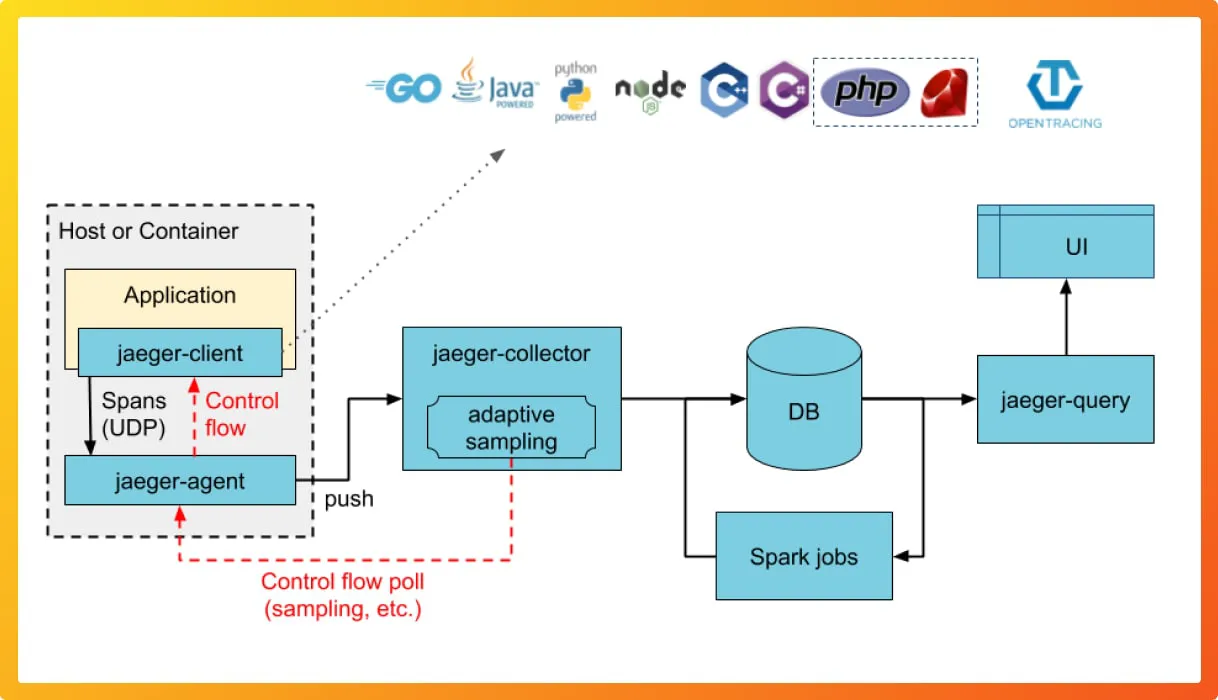
Architecture of Jaeger and Grafana Tempo
Jaeger and Grafana Tempo are somewhat similar, with the only difference being in their backend storage.
Jaeger supports two popular open-source NoSQL databases as trace storage backends:
- Cassandra
- ElasticSearch
Grafana Tempo was built to avoid the maintenance that is required to run databases like Cassandra and ElasticSearch. It has the following components in its architecture:
Distributor
It is used to accept spans in multiple formats.Ingestor
The Ingester batches trace into blocks and then flushes it all to the backend.Query frontend
Tempo uses Grafana for its visualization layer.Querier
It is responsible for finding the requested trace ID from the backend storage.Compactor
The Compactors stream blocks to and from the backend storage to reduce the total number of blocks.
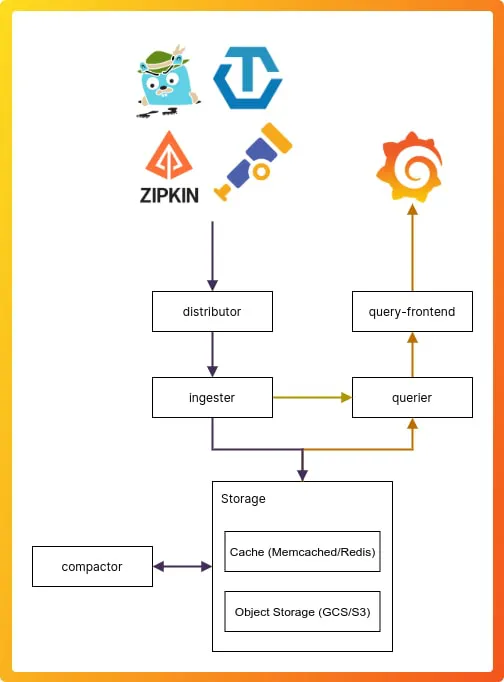
Comparing Jaeger and Grafana Tempo
There are four major components to a distributed tracing tool:
- Instrumentation
- Pipeline
- Backend
- Visualization
Let's see in detail what these components are and how Jaeger and Grafana Tempo handle these components.
Instrumentation
What is instrumentation?
Instrumentation is the process of generating telemetry data(logs, metrics, and traces) from your application code. It is essentially writing code that enables your application code to emit telemetry data, which can be used later to investigate issues.
Most distributed tracing tools offer clients libraries, agents, and SDKs to instrument application code. There are some popular open-source instrumentation frameworks too, which provide vendor-agnostic instrumentation libraries.
Instrumentation with Jaeger
Jaeger's client libraries for instrumentation are based on OpenTracing APIs. OpenTracing was an open-source project aimed at providing vendor-neutral APIs and instrumentation for distributed tracing. It later got merged into OpenTelemetry.
Jaeger has official client libraries in following languages:
- Go
- Java
- Node.js
- Python
- C++
- C#
Instrumentation with Grafana Tempo
Grafana Tempo supports multiple open-source instrumentation standards. It offers more flexibility to engineering teams to choose instrumentation libraries of their choice. Below is the list of popular frameworks used for client instrumentation and supported by Grafana Tempo:
- OpenTracing/Jaeger
- Zipkin
- OpenTelemetry
Pipeline
Once the trace data is collected with the help of client libraries, it can be directly sent to the storage backends for storage and visualization. But it's a good practice to have a tracing pipeline for data buffering as the application scales. The pipeline enables receiving data in multiple formats, manipulation, batching, indexing, and queueing.
Jaeger provides Jaeger collectors, as seen in the architecture diagram. The collectors validate traces, index them and perform any transformation before storing the trace data.
Grafana Tempo has Grafana agents, which are deployed close to the application. It quickly offloads traces from the application and performs functions like trace batching and backend routing.
Backend storage
Jaeger ships with simple in-memory storage for testing setups.Jaeger supports two popular open-source NoSQL databases as trace storage backends:
- Cassandra
- ElasticSearch
Grafana Tempo has its own custom TempoDB for storing trace data. TempoDB supports S3, GCS, Azure, local file systems, and optionally can use Memcached or Redis for increased query performance.
Visualization layer
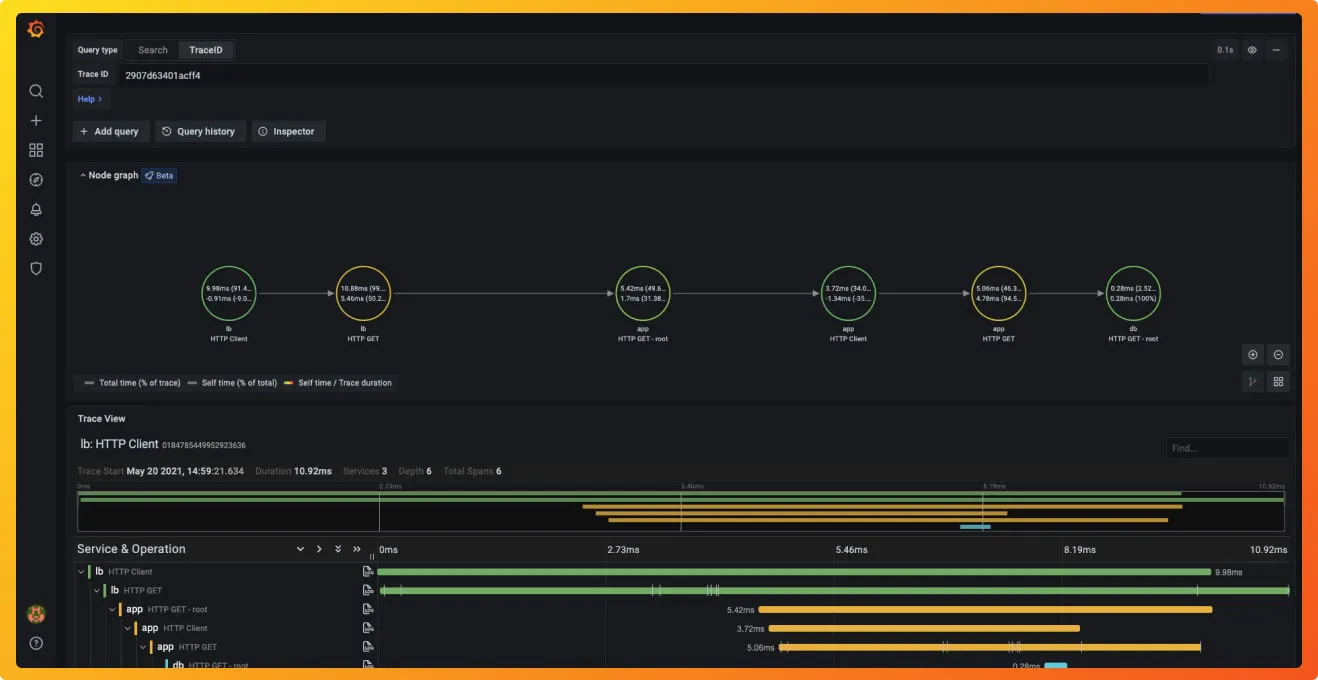
In terms of the visualization layer, Grafana Tempo has the edge over Jaeger. Grafana Tempo is distributed tracing tool by Grafana - an open-source data visualization layer. You can connect different data sources to Grafana for visualization. Grafana has a built-in Tempo data source that can be used to query Tempo and visualize traces.
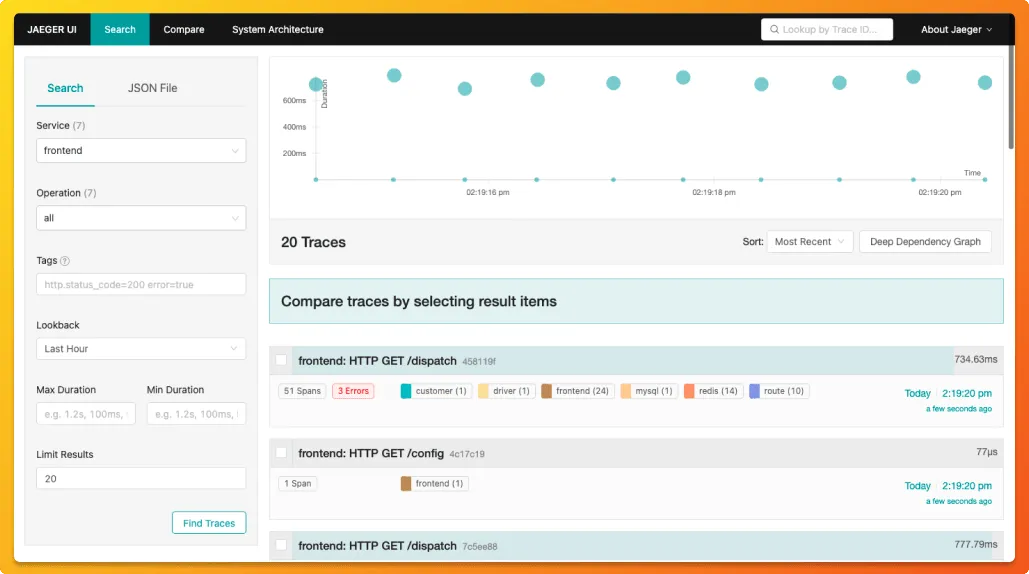
Jaeger's UI is basic but comprehensive when it comes to distributed tracing.
Both Jaeger and Grafana Tempo are strong contenders when it comes to a distributed tracing tool. But are traces enough to solve all performance issues of a modern distributed application? The answer is no. You also need metrics and a way to correlate metrics with traces within a single dashboard. You also need out-of-the-box data visualization that will enable engineering teams to resolve issues faster.
That's where SigNoz comes into the picture.
Alternative to Jaeger and Grafana Tempo - SigNoz
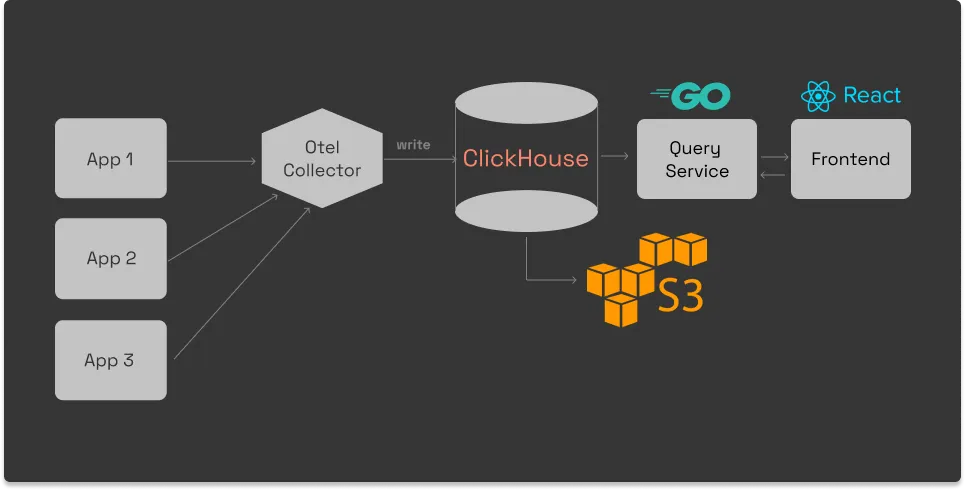
SigNoz is a full-stack open-source application performance monitoring and observability tool which can be used in place of Grafana Tempo and Jaeger. It provides advanced distributed tracing capabilities along with metrics under a single dashboard.
SigNoz is built to support OpenTelemetry natively. OpenTelemetry is becoming the world standard for generating and managing telemetry data (Logs, metrics, and traces). It also provides a fast OLAP datastore, ClickHouse as the storage backend.
SigNoz comes with out of box visualization of things like RED metrics.
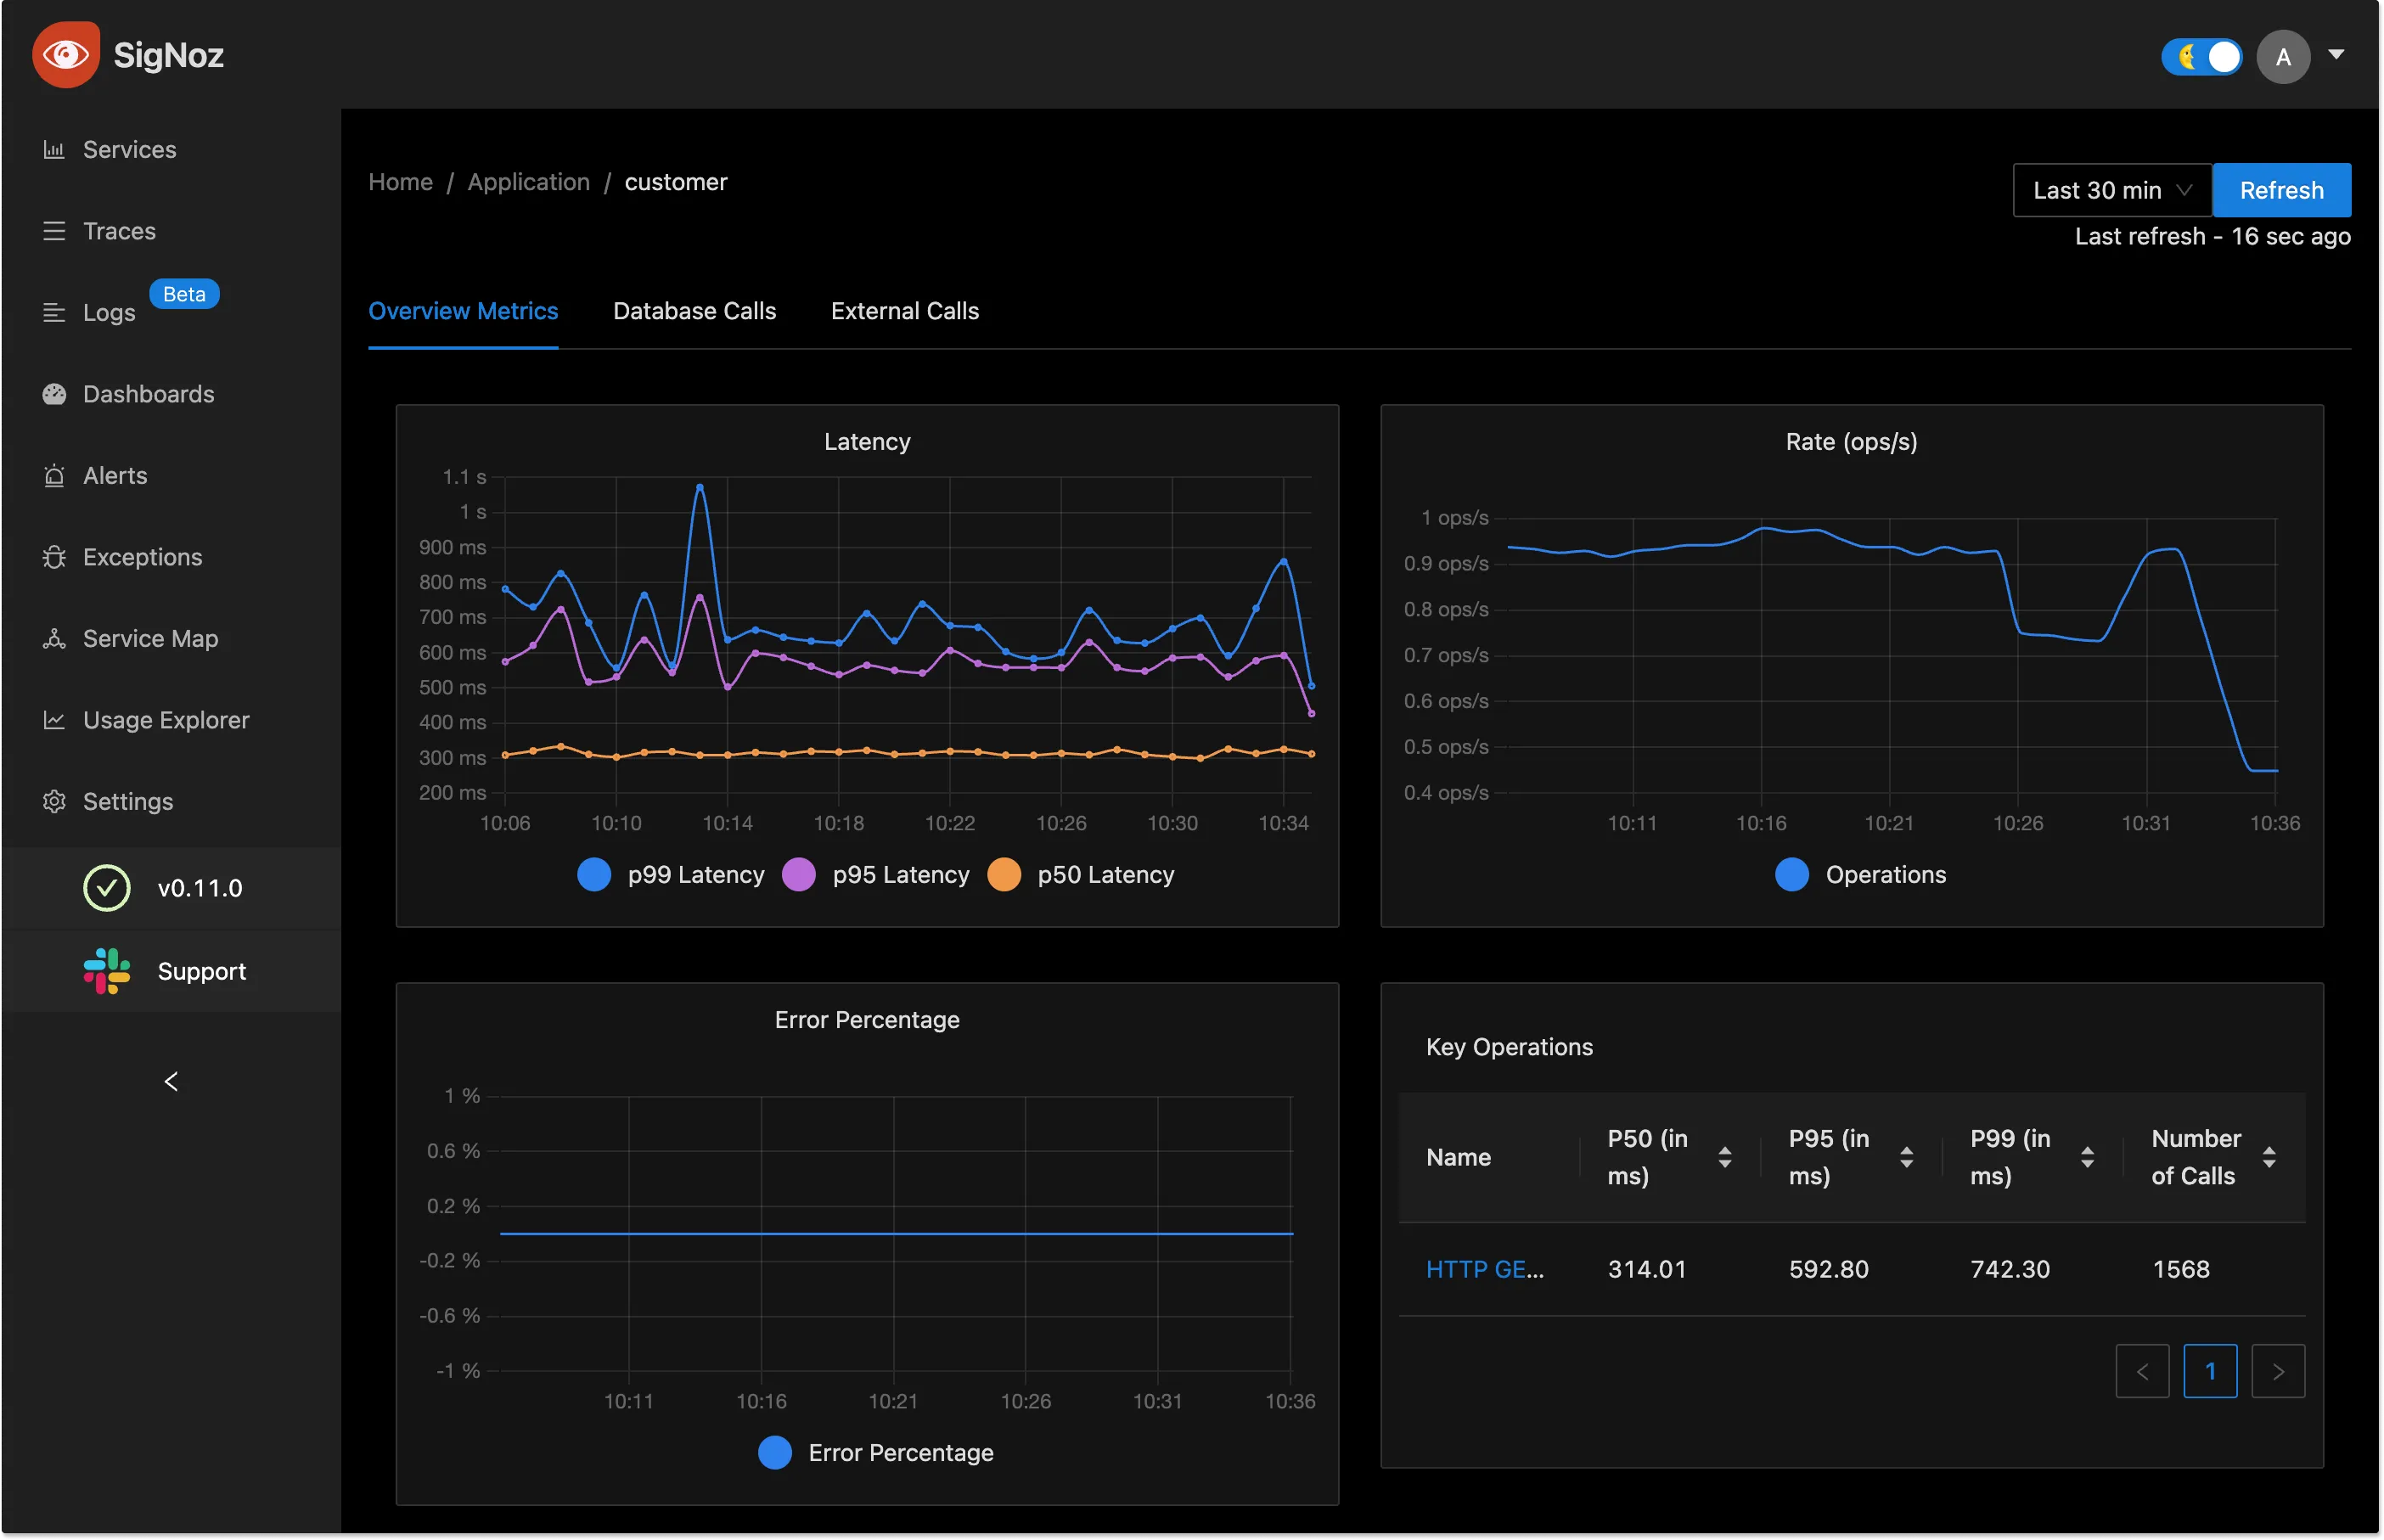
You can also use flamegraphs to visualize spans from your trace data. All of this comes out of the box with SigNoz.
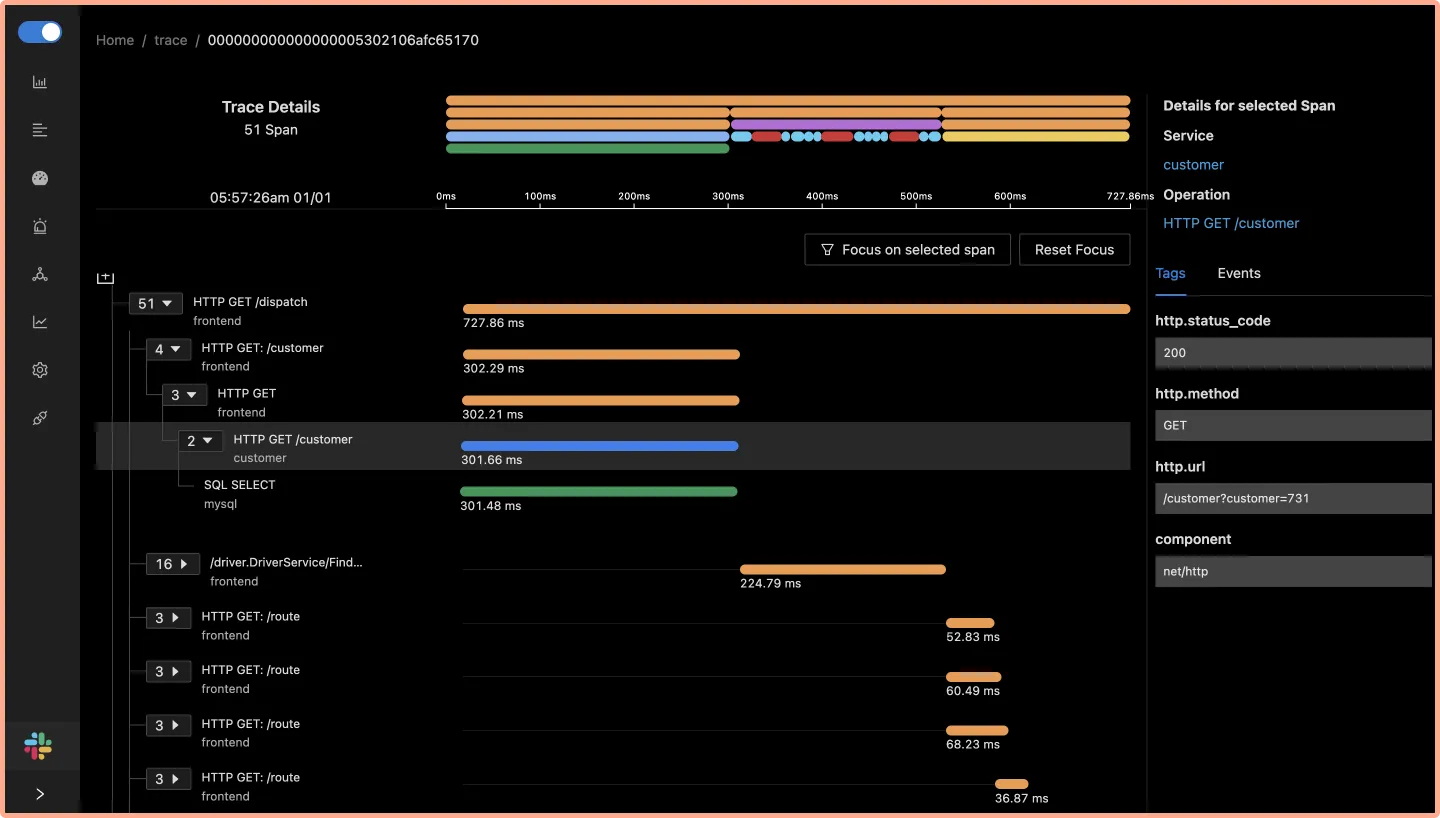
Some of the things SigNoz can help you track:
- Application overview metrics like RPS, 50th/90th/99th Percentile latencies, and Error Rate
- Slowest endpoints in your application
- See exact request trace to figure out issues in downstream services, slow DB queries, call to 3rd party services like payment gateways, etc
- Filter traces by service name, operation, latency, error, tags/annotations.
- Run aggregates on trace data
- Unified UI for both metrics and traces
Getting started with SigNoz
You can get started with SigNoz using just three commands at your terminal.
git clone -b main https://github.com/SigNoz/signoz.git
cd signoz/deploy/
./install.sh
For detailed instructions, you can visit our documentation.
You can check out SigNoz's GitHub repo here 👇
Related Content
Jaeger vs Zipkin
Jaeger vs SigNoz
Jaeger vs Elastic APM
Jaeger vs New Relic


