Jaeger and New Relic are tools used in the application monitoring and observability domain. While Jaeger is an open source tool under Cloud Native Computing Foundation, New Relic is a SaaS vendor in the observability domain. Let us explore the key differences between Jaeger and New Relic in this article.
New Relic is an extensive SaaS tool and provides application performance as well as infrastructure monitoring. Jaeger provides an open-source solution for end-to-end distributed tracing. Before we dive in, let's first understand in brief what is distributed tracing.
What is distributed tracing?
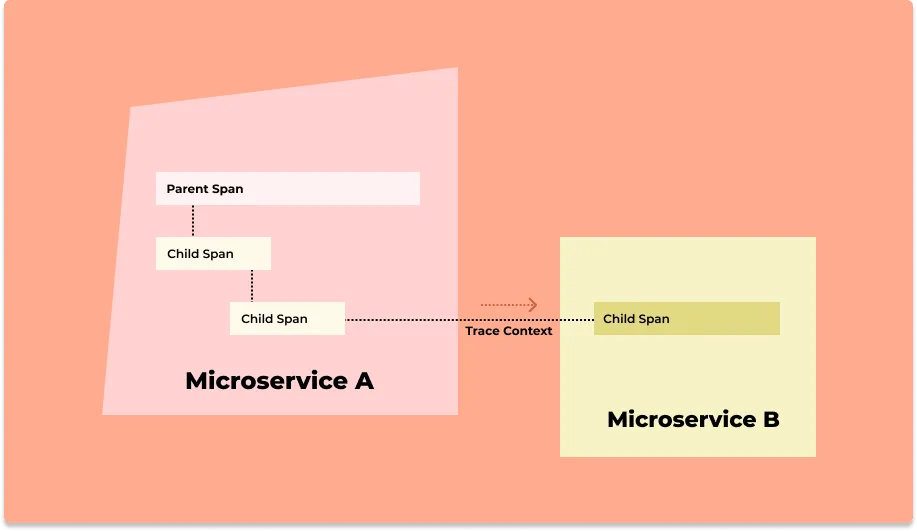
Distributed tracing gives you insight into how a particular service is performing as part of the whole in a distributed software system. In a microservice architecture, a transaction can travel through hundreds of services before completing a user request. So how do you know the exact cause of issues causing latency?
That's where distributed tracing comes into the picture. User requests are broken down into spans.
What are spans?
Spans represent a single operation within a trace. Thus, it represents work done by a single service which can be broken down further depending on the use case.
A trace context is passed along when requests travel between services, which tracks a user request across services. You can see how a user request performs across services and identify what exactly needs your attention without manually shifting through multiple dashboards.
Key Features of Jaeger
Jaeger was originally built by teams at Uber and then open-sourced. It is used for end-to-end distributed tracing for microservices. Some of the key features of Jaeger includes:Distributed context propagation
One of the challenges of distributed systems is to have a standard format for passing context across process boundaries and services. Jaeger provides client libraries that supports code instrumentation in multiple languages to propagate context across servicesDistributed transaction monitoring
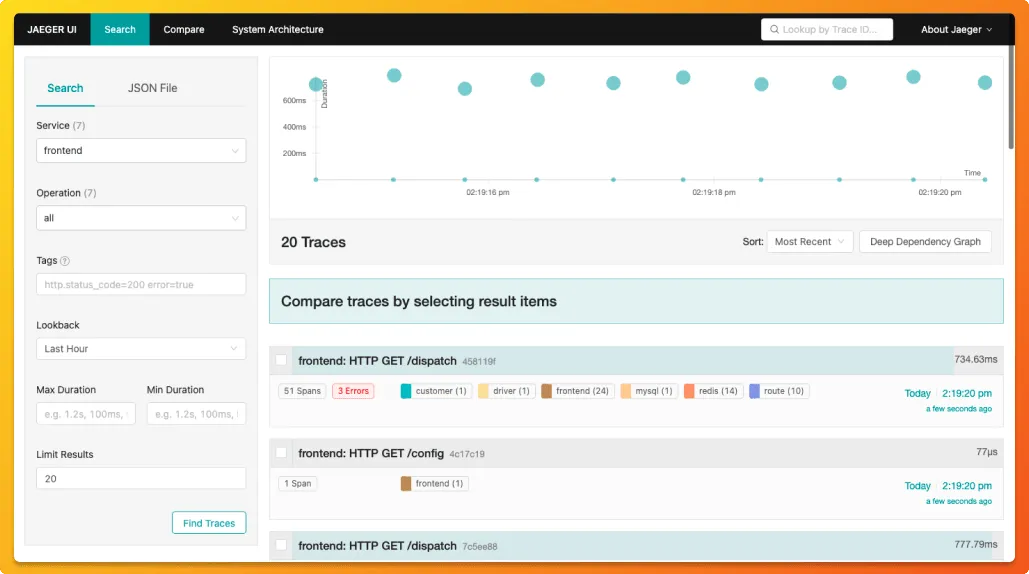
Jaeger comes with a web UI written in Javascript. The dashboard can be used to see traces and spans across services.Root Cause Analysis
Using traces you can drill down to services causing latency in particular user request.Server dependency analysis
Using Jaeger's web UI, you can see how requests flow through different services and different servers interact while serving user requets.Performance/latency optimization
Once you have identified, which service or query is creating latency, you can use the information to optimize it.
Key Features of New Relic
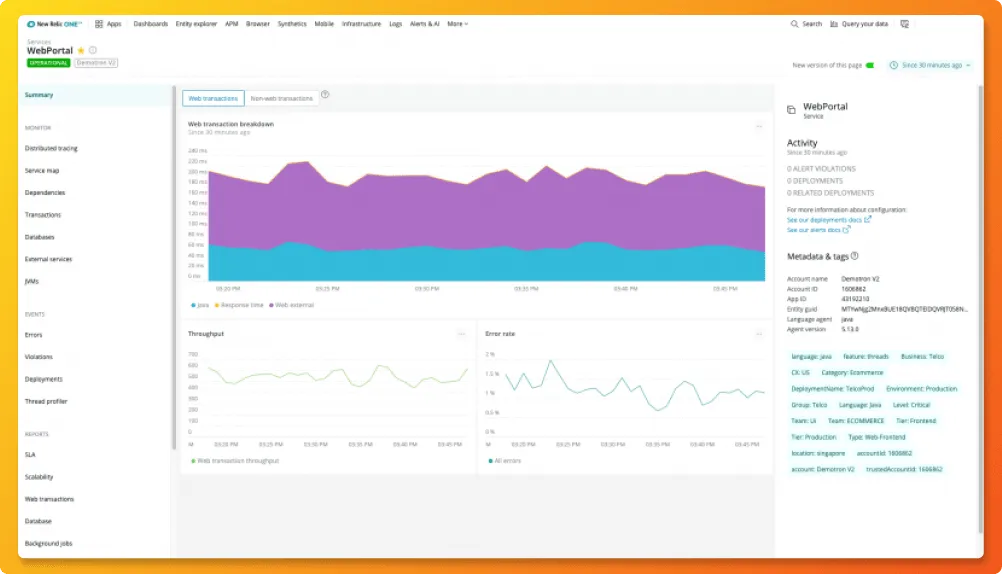
New Relic is one of the oldest companies in the observability domain. Its observability tool enables you to visualize, analyze and troubleshoot your software stack in one platform. It also supports auto-instrumentation for eight popular programming languages.Some of the key features and services that New Relic provides:
Infrastructure monitoring
New Relic can connect your application performance with your infrastructure health to provide you better insights for quick troubleshooting.Telemetry Data platform
It provides 300+ agents and integrations, including OpenTelemetry to ingest all kinds of telemetry data.AIOps
New relic also provides artificial intelligence capabilities to detect, diagnose and resolve issues before customer notices.Log management
You can also deploy log management using New Relic. It provides a fast query service on top of your log data so that you're always on top of your log data.Integrations with tools and open standards
New Relic provides integrations with all leading cloud providers and also supports popular open-source standards like OpenTelemetry.
As New Relic is a SaaS vendor, it is not free. Standard offering includes plans for teams up to 5 full users. Their pricing depends on the amount of data ingested with 100 GB free data ingest and $0.25 per extra GB.
Comparing Jaeger and New Relic
From the description above, you might have a good idea about the differences between Jaeger and New Relic. The key difference between the two projects is their scope. While Jaeger is an end-to-end distributed tracing tool, New Relic is a SaaS vendor offering many out-of-the-box services.
Apart from distributed tracing, New Relic offers log management, infrastructure monitoring, network monitoring, and application monitoring. It also provides AIOps capabilities.
Let's focus on the distributed tracing capabilities of both the tools and see their key differences:
Jaeger's instrumentation is based on OpenTracing standards, and it provides client libraries in the following languages: Go, Java, Node.js, Python, C++, and C#. New Relic provides APM language agents for C, Go, Java, Node.js, .NET, PHP, Python, and Ruby to help you get started with distributed tracing.
Jaeger offers two popular open-source databases for storing trace data: Cassandra and Elasticsearch. New Relic offers its own custom-built time-series database called New Relic Database to store trace data.
New Relic's tracing UI is more elaborate than Jaeger's, as you can relate data from other types of monitoring in a single dashboard.
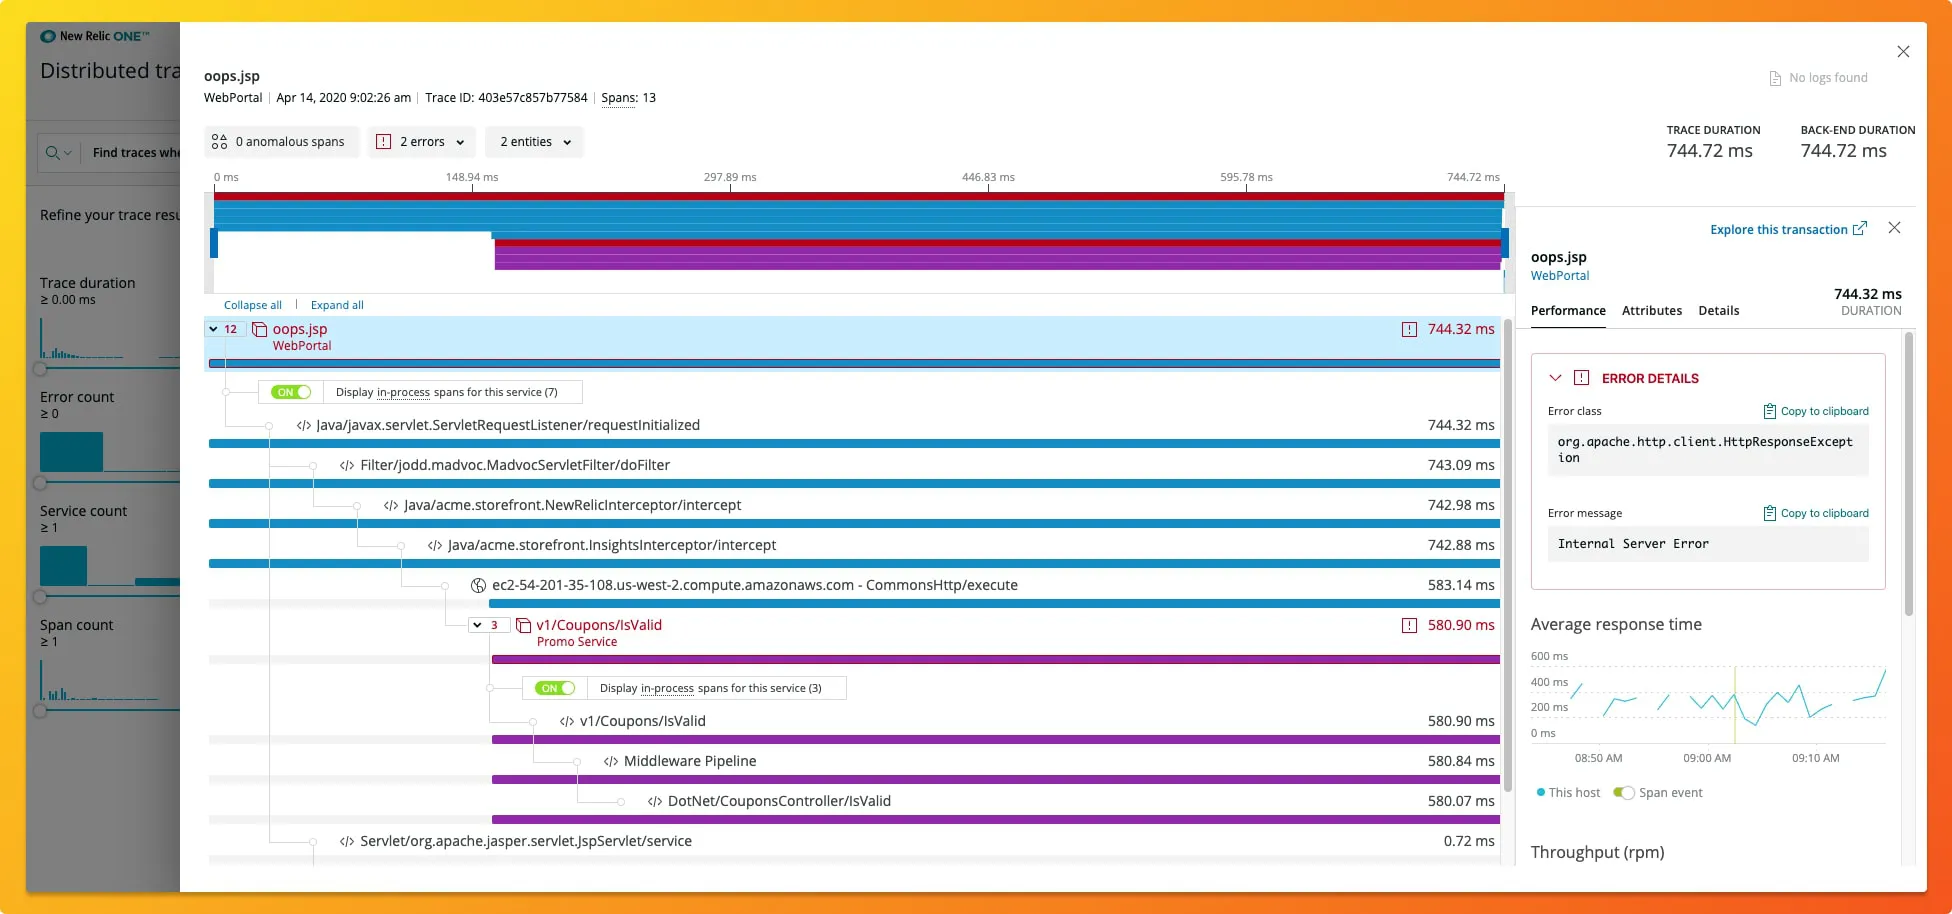
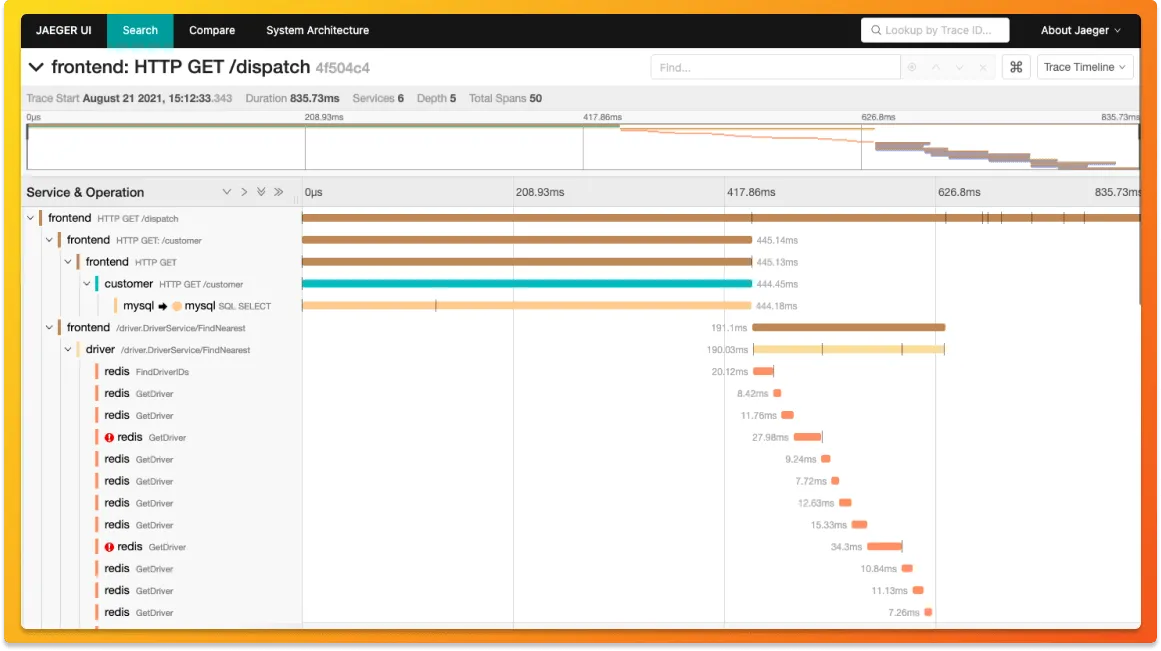
It's no surprise that New Relic has better features than Jaeger as it's paid. Pricing of most APM tools is not cheap, and the call to use one should be made on the basis of your business impact.
Alternative to Jaeger and New Relic
Jaeger and New Relic are both established tools in the observability domain. But Jaeger fells short on providing a robust observability framework since it only does distributed tracing. SaaS vendors like New Relic come with their own set of concerns, like sending your data to a 3rd party cloud vendor.
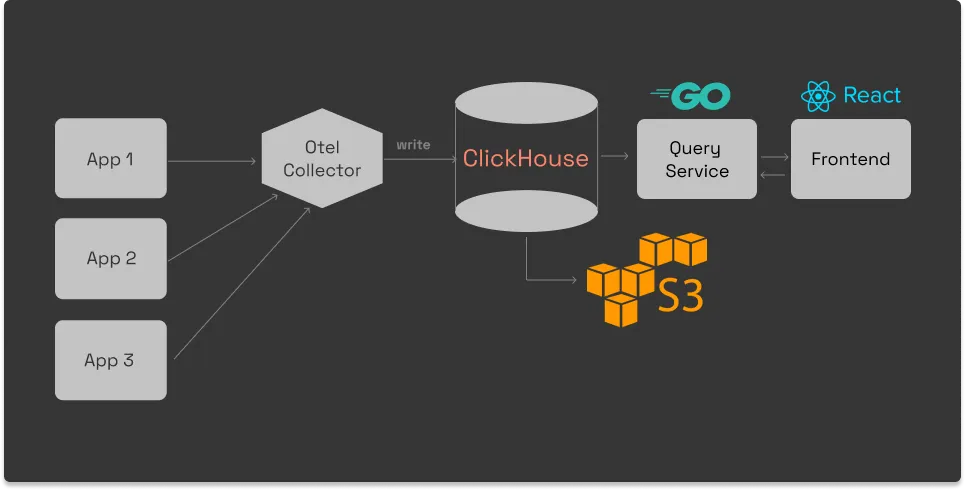
That's where SigNoz comes into the picture. SigNoz is a full-stack open-source application performance monitoring and observability tool which can be used in place of Jaeger. SigNoz is built to support OpenTelemetry natively. It provides a fast OLAP datastore, ClickHouse as the storage backend.
SigNoz comes with out of box visualization of things like RED metrics.
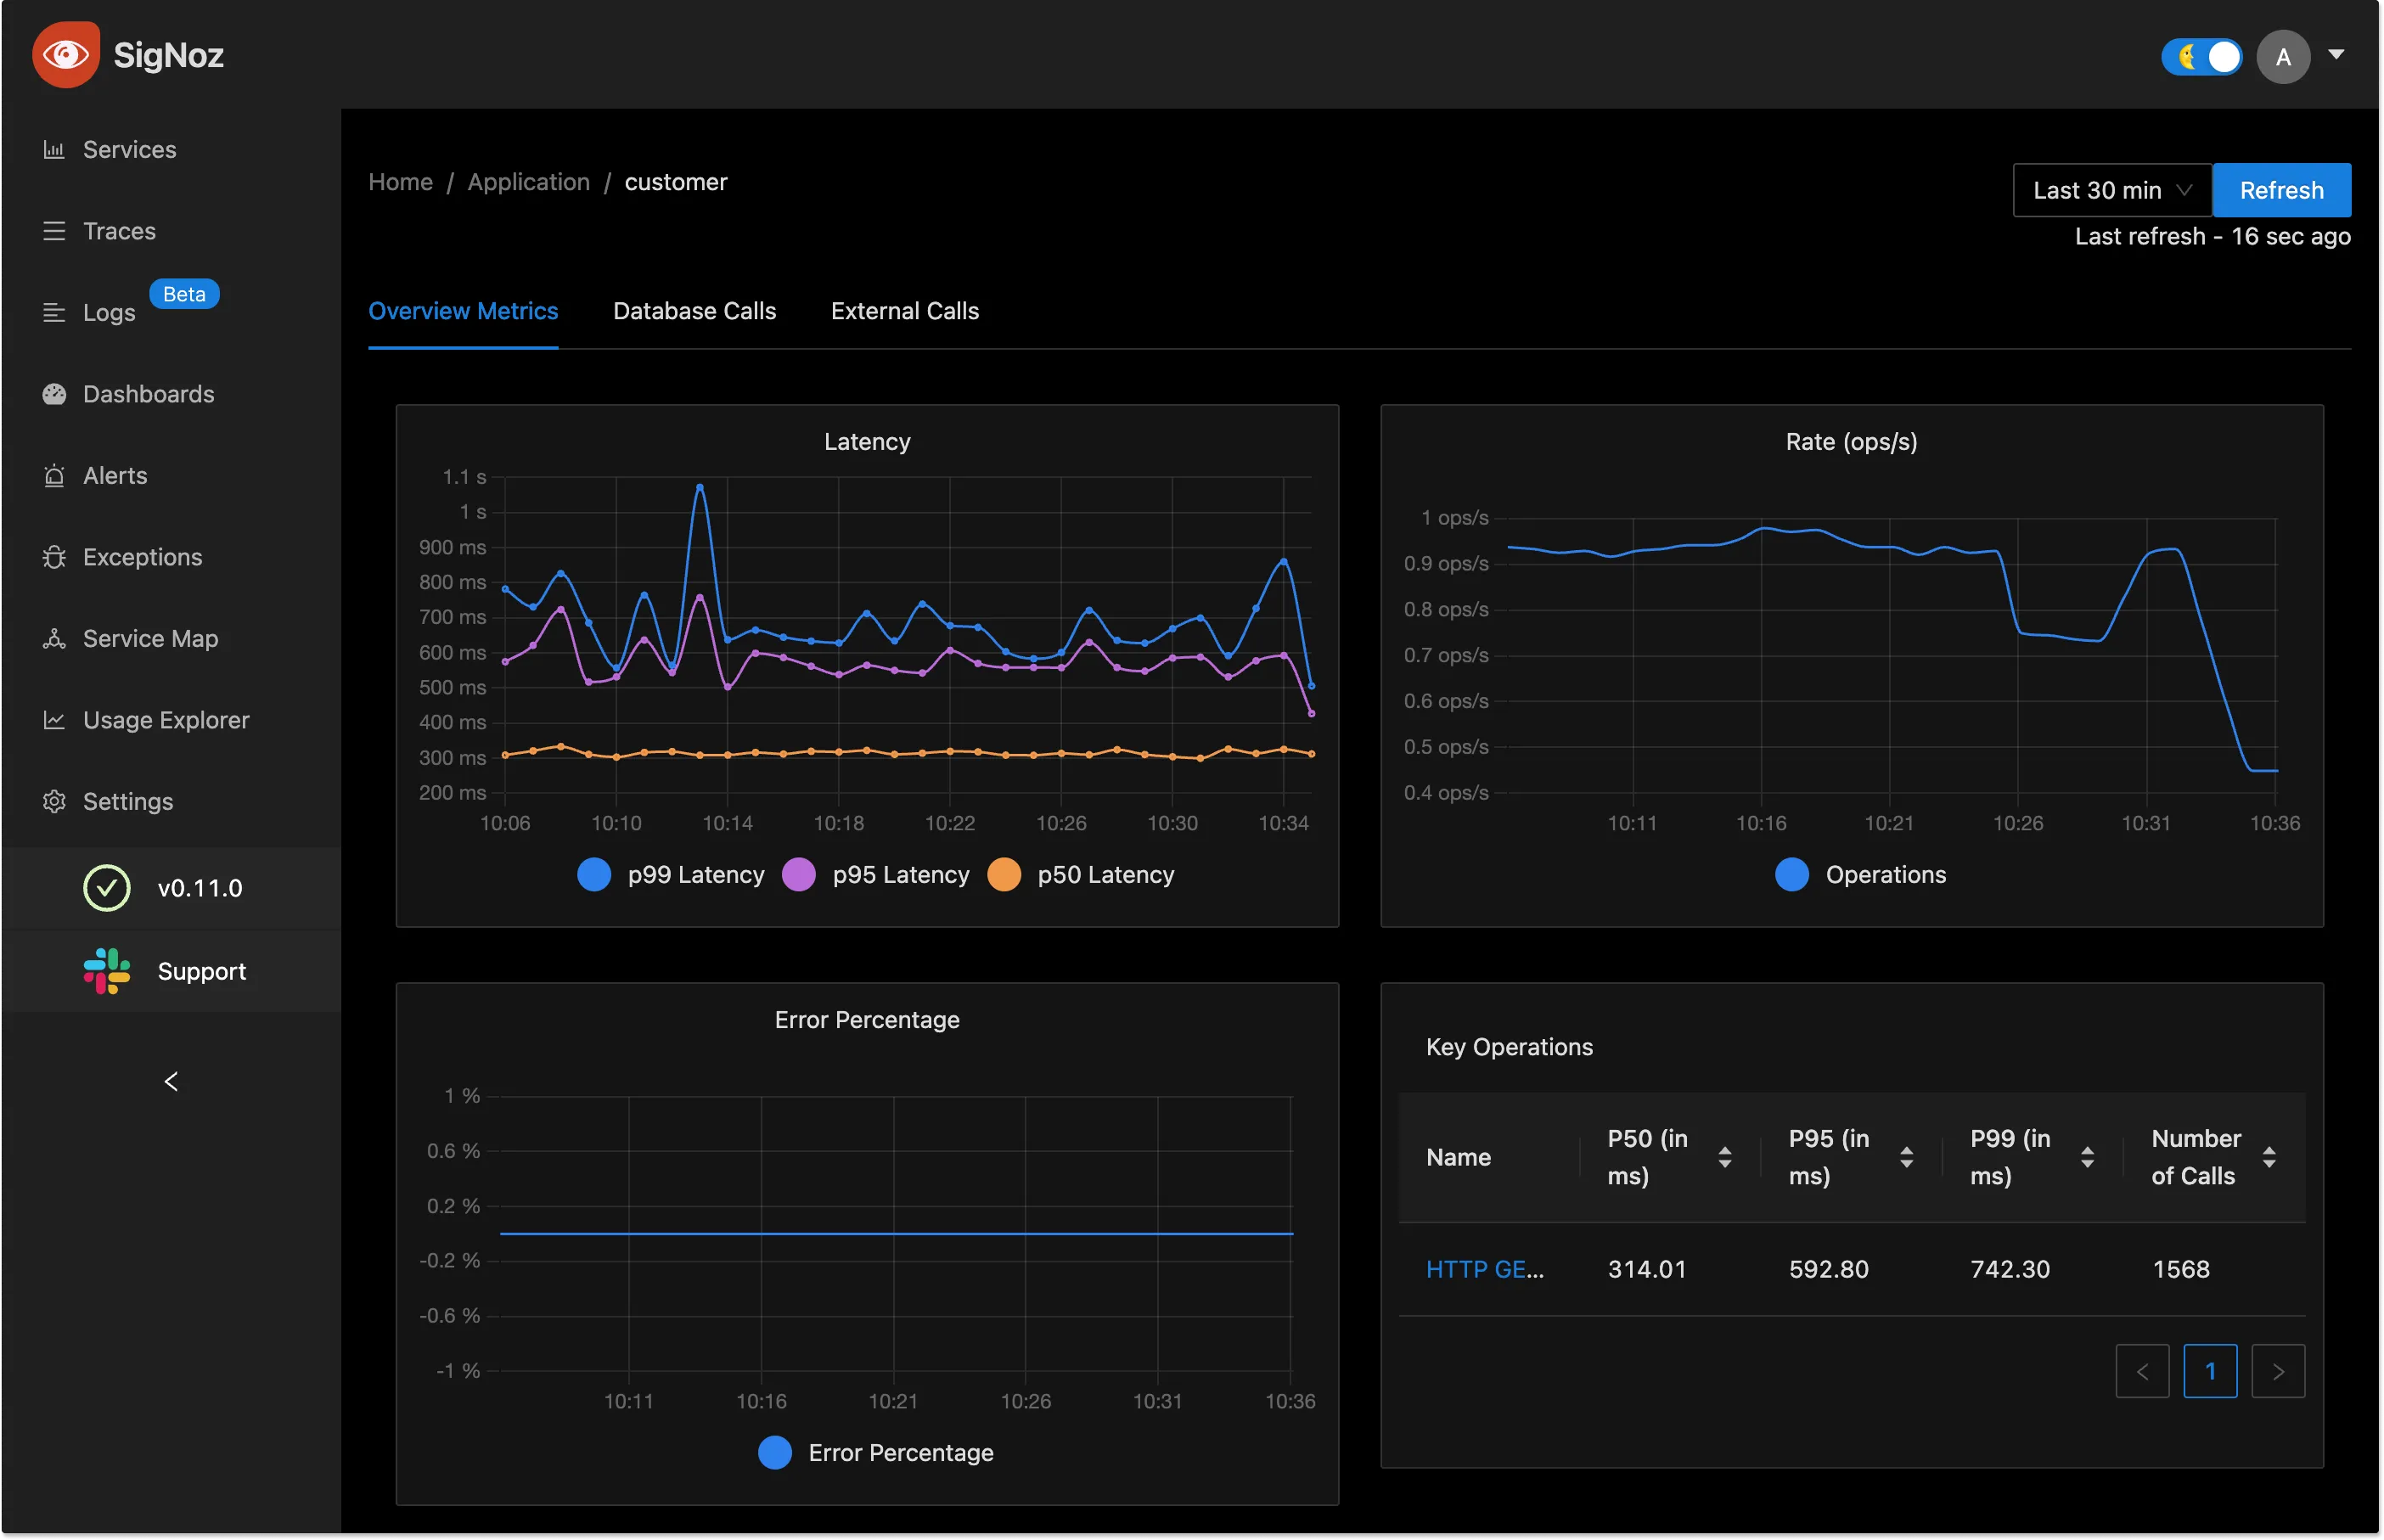
Some of the things SigNoz can help you track:
- Application overview metrics like RPS, 50th/90th/99th Percentile latencies, and Error Rate
- Slowest endpoints in your application
- See exact request trace to figure out issues in downstream services, slow DB queries, call to 3rd party services like payment gateways, etc
- Filter traces by service name, operation, latency, error, tags/annotations.
- Run aggregates on trace data
- Unified UI for both metrics and traces
Getting started with SigNoz
You can get started with SigNoz using just three commands at your terminal.
git clone -b main https://github.com/SigNoz/signoz.git
cd signoz/deploy/
./install.sh
For detailed instructions, you can visit our documentation.
You can check out SigNoz's GitHub repo here 👇
Related Content
Jaeger vs Prometheus
Jaeger vs SigNoz
Jaeger vs Zipkin
Jaeger vs DataDog


