OpenTelemetry is a collection of APIs, SDKs, and libraries that provide an open source observability framework for instrumenting, generating, collecting, and exporting telemetry data like metrics, traces, and logs. It is incubated under Cloud Native Computing Foundation (CNCF), the same foundation which incubated Kubernetes.
OpenTelemetry is quietly becoming the world standard for instrumenting cloud-native applications. The biggest advantage of using OpenTelemetry is that it provides a single observability framework for all kinds of telemetry data - metrics, traces, and logs.
In this post, we will give you a brief introduction to OpenTelemetry metrics.
The OpenTelemetry Signals - logs, metrics, and traces
Let’s have a brief idea about the different OpenTelemetry signals.
Logs represent recordings of an event to allow their tracking over time. They can be binary, plaintext, or even structured as JSON.
Traces as the term suggests, follow through the occurrence of similar events. These come in handy when determining relationships/causes of already logged events.
Metrics offer a picture/insight into specific durations of measured events. An example is how many times an event transpired over the desired observation period.
Examples of metrics include the following:
Error rate
Let's assume your program is crashing or throwing errors out of the blue. It happens. Having a counter instrument observing how many errors occur on a daily basis can help reveal their causes after further inspection.Operation latency
An observation of the actual time lapsed, not the CPU time, for an operation to go from start to finish. If you measure this for a wide range of operations, you learn when they occurred, how long they were live, and any connected operations. Low latency might indicate a slow network or too many dependencies for an operation.Cache statistics
You can observe the hit/miss/error metrics of your cache using OpenTelemetry's ObservableCounter instrument. High hit rates would indicate optimized search data serving, while more misses and errors hint at the need for a better caching strategy.
Now that we know a little more about OpenTelemetry and metrics, the next step is finding out how they are collected.
How Metrics Are Collected
To fully grasp how metrics (examples above) end up on a visualization interface, let's look at the architecture of a typical OpenTelemetry Metric API.
The OpenTelemetry metrics API consists of three components:
- Meter Provider
- Meter
- Instruments
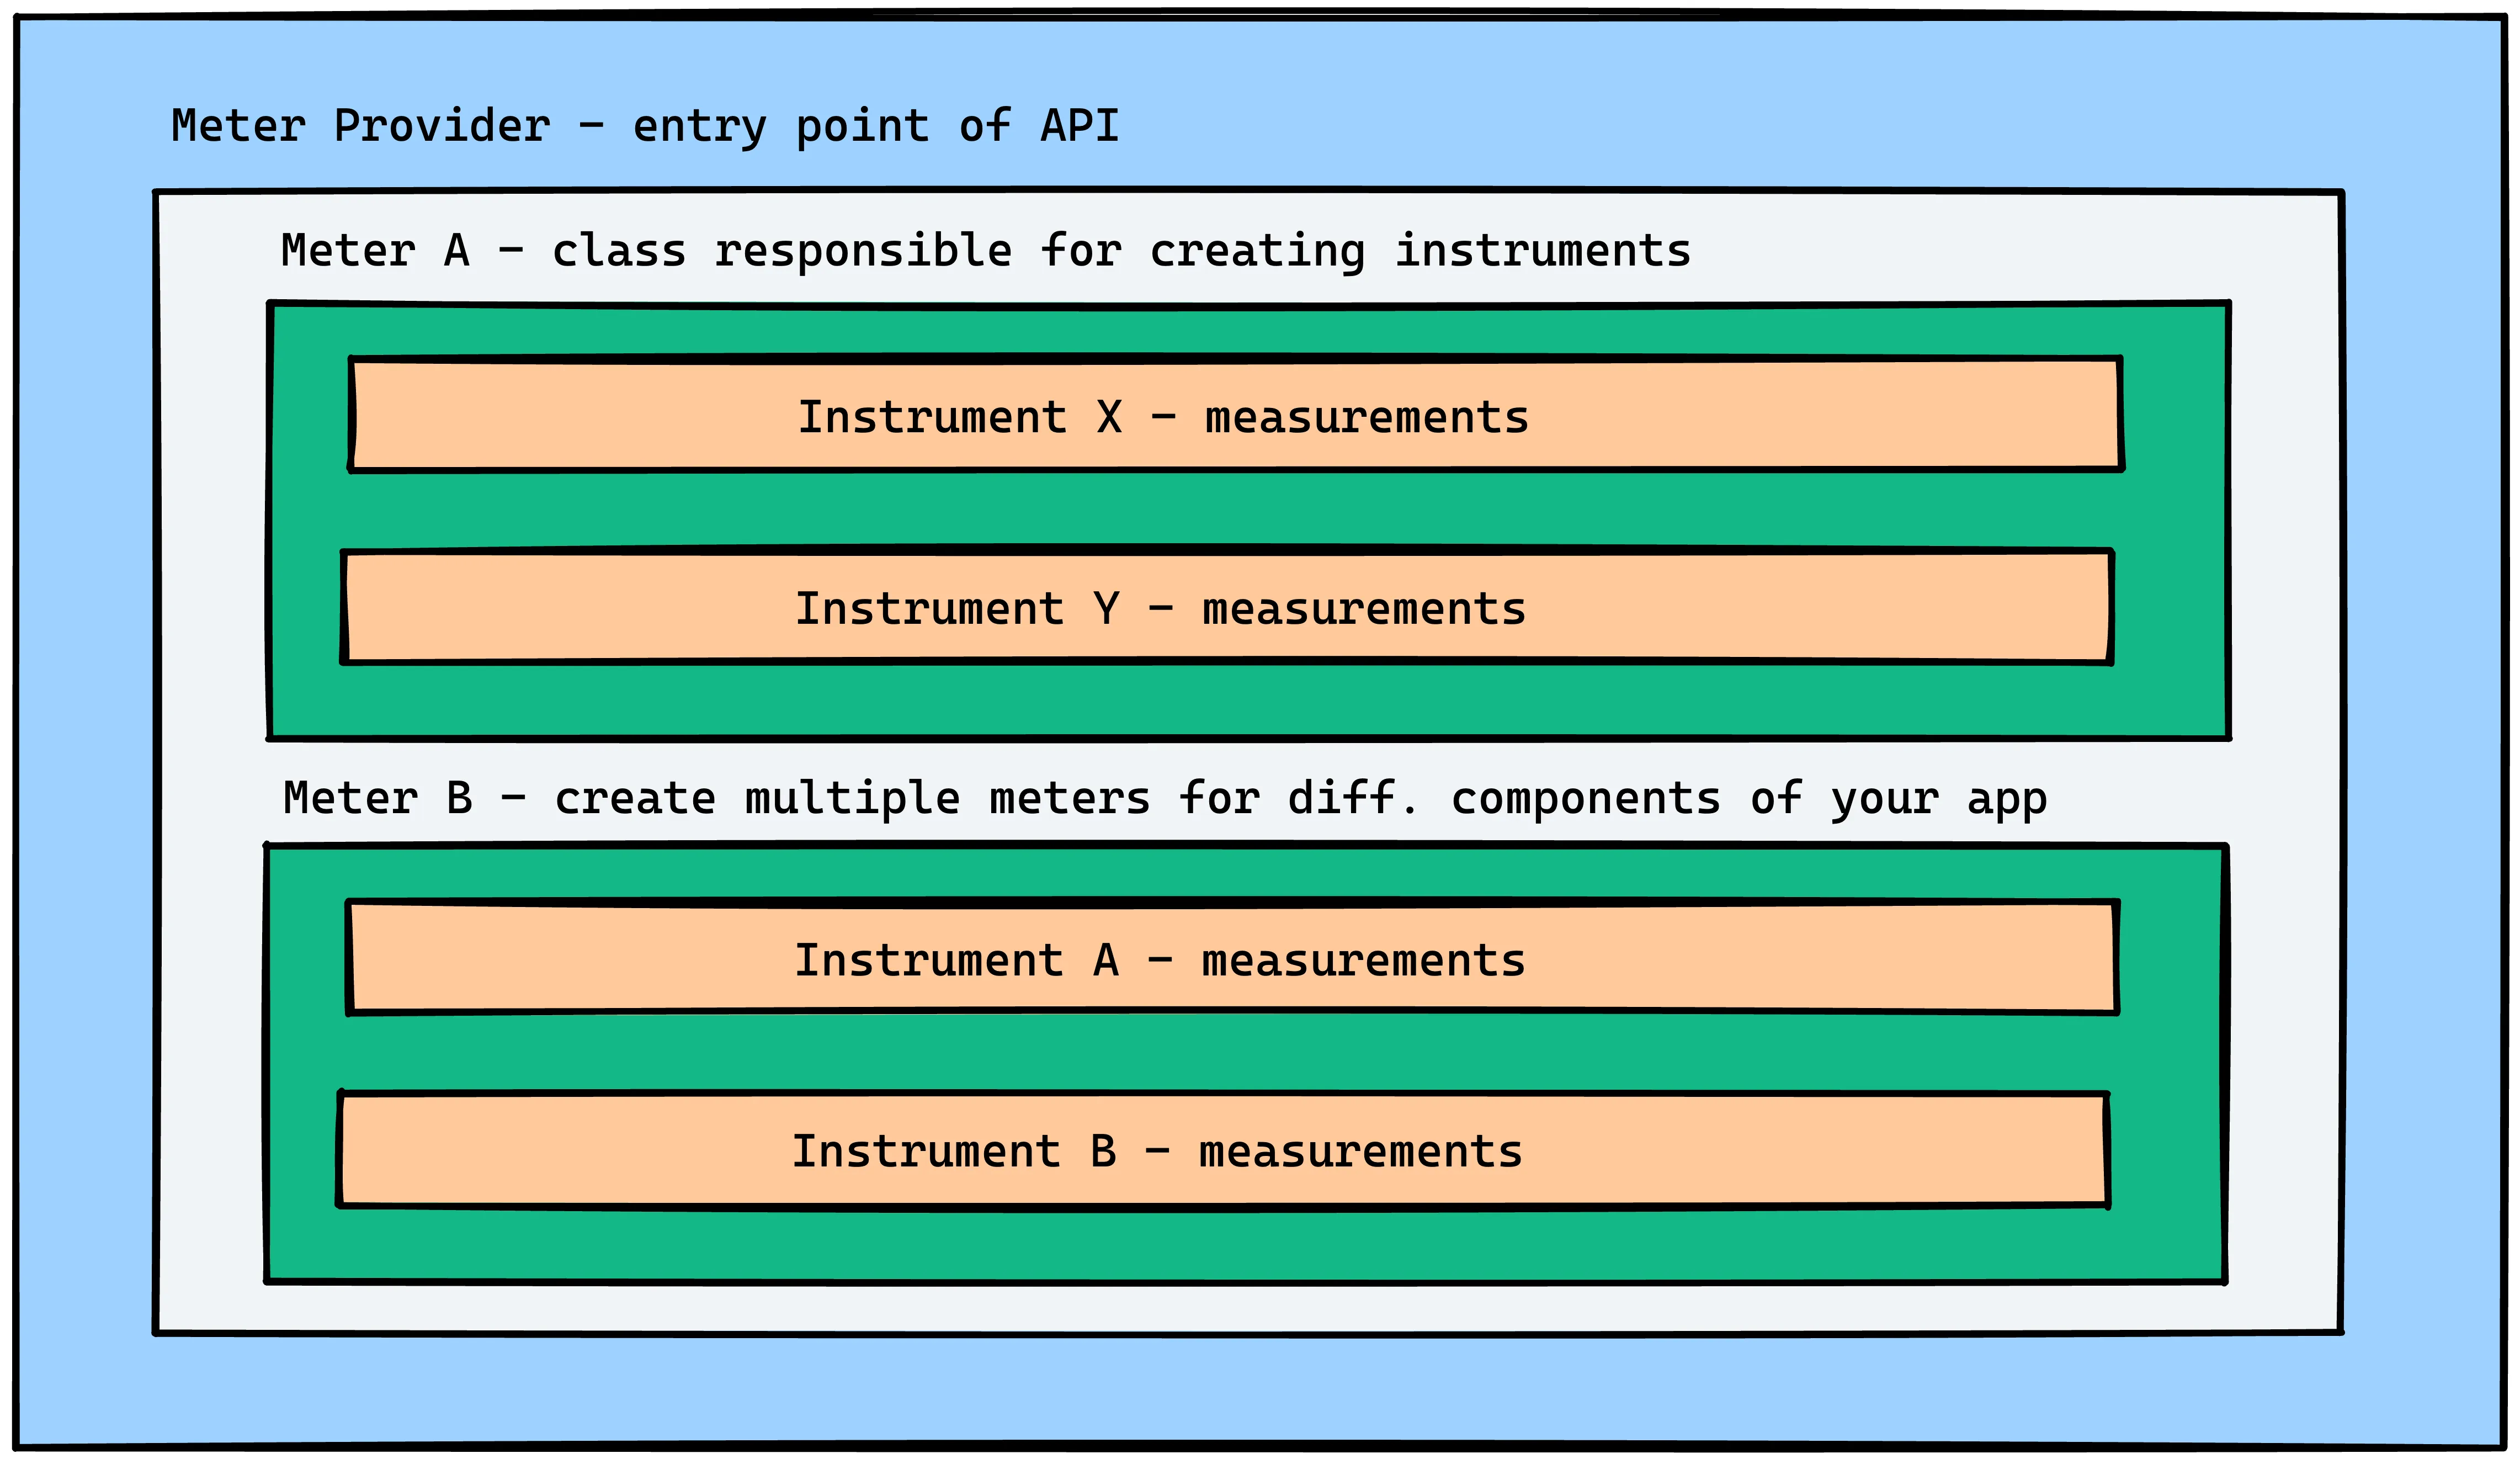
Here’s a brief introduction to each component.
MeterProvider - An instance that serves as the entry point for a metric API. Typically there exists a default meter provider and a few other custom objects depending on a project's metric endpoints. API configurations should be specified within the provider as they apply to underlying elements (2 and 3 below).
Meter - A meter is classified under/within a provider. There can be as many meters as required by the scope of a project, each with a name label and version number. The core function of a meter is to call the instruments that classify and collect metrics (3 below).
Instrument - This is the endpoint of a metric API. It is denoted by a label name, type (histogram/counter/etc.) and kind (sync/async - more on these soon), a unit of measurement (optional), and clear description text (also optional). The instrument details show that actual measurements are exported from within an application. Also, there can be as many instruments as required for reporting purposes.
The actual implementation of the three elements above depends on the language of your app's backend. However, the following general flow stands regardless.
<declaration of the provider><provider_name><global_configs> {

<set_meter><meter_name><meter_version>{

    <instrument#1><type><async/sync><unit><description>
    <instrument#2>....
    .
    .
    <instument#n>...
}

}
Here's an example implementation in JavaScript:
function startMetrics(){
    console.log('STARTING METRICS');

    const meterProvider = new meterProvider();
    metrics.setGlobalMeterProvider(meterProvider);

    meterProvider.addMetricReader(new PeriodicExportingMetricReader({
        exporter: new OTLPMetricExporter(),
        exportIntervalMillis: 1000
    }));

    meter = meterProvider.getMeter('example-exporter-collector')

    const requestCounter = meter.createCounter('request',{
        description: "Example of a counter"
    });

    const upDownCounter = meter.createUpDownCounter('test_up_down_counter',{
        description: "Example of a UpDownCounter"
    });

    const attributes = {environment: 'staging'}

    interval = setInterval(() => {
        requestCounter.add(1, attributes);
        upDownCounter.add(Math.random() > 0.5?1:-1,attributes);
    }, 1000);

}
Some programming languages, like Java, come in handy with an auto instrumentation option using their associated OpenTelemetry SDK.
OpenTelemetry Instrumentation for Metrics Monitoring
We introduced the concept of synchronous and asynchronous instruments for monitoring metrics a few passages above. Laying out the differences between the two should assist the reader in creating API instruments knowing exactly what gets displayed after measurements are exported.
Understanding Synchronous Instruments
When an instrument instance is called when an event being measured occurs, they're classified as synchronous. A good example of this is when a user clicks an app element that's being observed.
counter.Add(unit, 1)
In this case, the instrumentation can have an Add( ) function that increases a visualized number with the number of times the event occurs. Depending on how they manipulate measurements, synchronous instruments can be simple/monotonic, additive in a single direction, or even group their findings for analysis.
Common synchronous metric instruments include the following:
- Histogram (grouping)
- Counter (monotonic)
- UpDownCounter (additive)
Understanding Asynchronous Instruments
Asynchronous instruments, unlike their counterpart, only observe measurements once per specified duration lapse. So, instead of the count mechanism, they observe.
Observe (update event record)
Typical application areas for asynchronous instruments include the monitoring of resource utilization (% CPU usage), memory allocation for processes, and cache misses. Again these measurements can have a single direction and incrementing pattern (monotonic), grouping, and additive impact on the records being observed.
Common asynchronous instruments include the following:
- GaugeObserver (grouping)
- UpDownCounterObserver (additive)
- CounterObserver (monotonic)
If you go back and scan the JS metric API instrumentation example in the image above, you'll notice the instrument declaration:
const UpDownCounter = meter.createUpDownCounter('test_up_down_counter', {
description: 'Example of a UpDownCounter',
});
The UpDownCounter instrument example should now make more sense.
Getting The Most From OpenTelemetry Metrics
With the knowledge at hand, one should be able to explain the source of metrics and, with a little tinkering of OTel quickstarts, build custom metric providers, meters, and instruments. A common practice you'll find among system administrators is the augmenting of observability by pairing OTel with other tools. One of the key focus of OpenTelemetry metrics is to provide interoperability. The metrics ecosystem is full of popular solutions like Prometheus and StatsD. OpenTelemetry aims to provide support for major metrics implementation.
OpenTelemetry provides an OpenTelemetry collector, which can be used to create data pipelines. For metrics, you can use the OpenTelemetry collector to scrape Prometheus metrics, collect, and process them before exporting them to an observability backend of your choice.
OpenTelemetry only provides a way to generate, collect, and export telemetry data. You then have the freedom to select an observability backend of your choice. That’s where SigNoz comes into the picture.
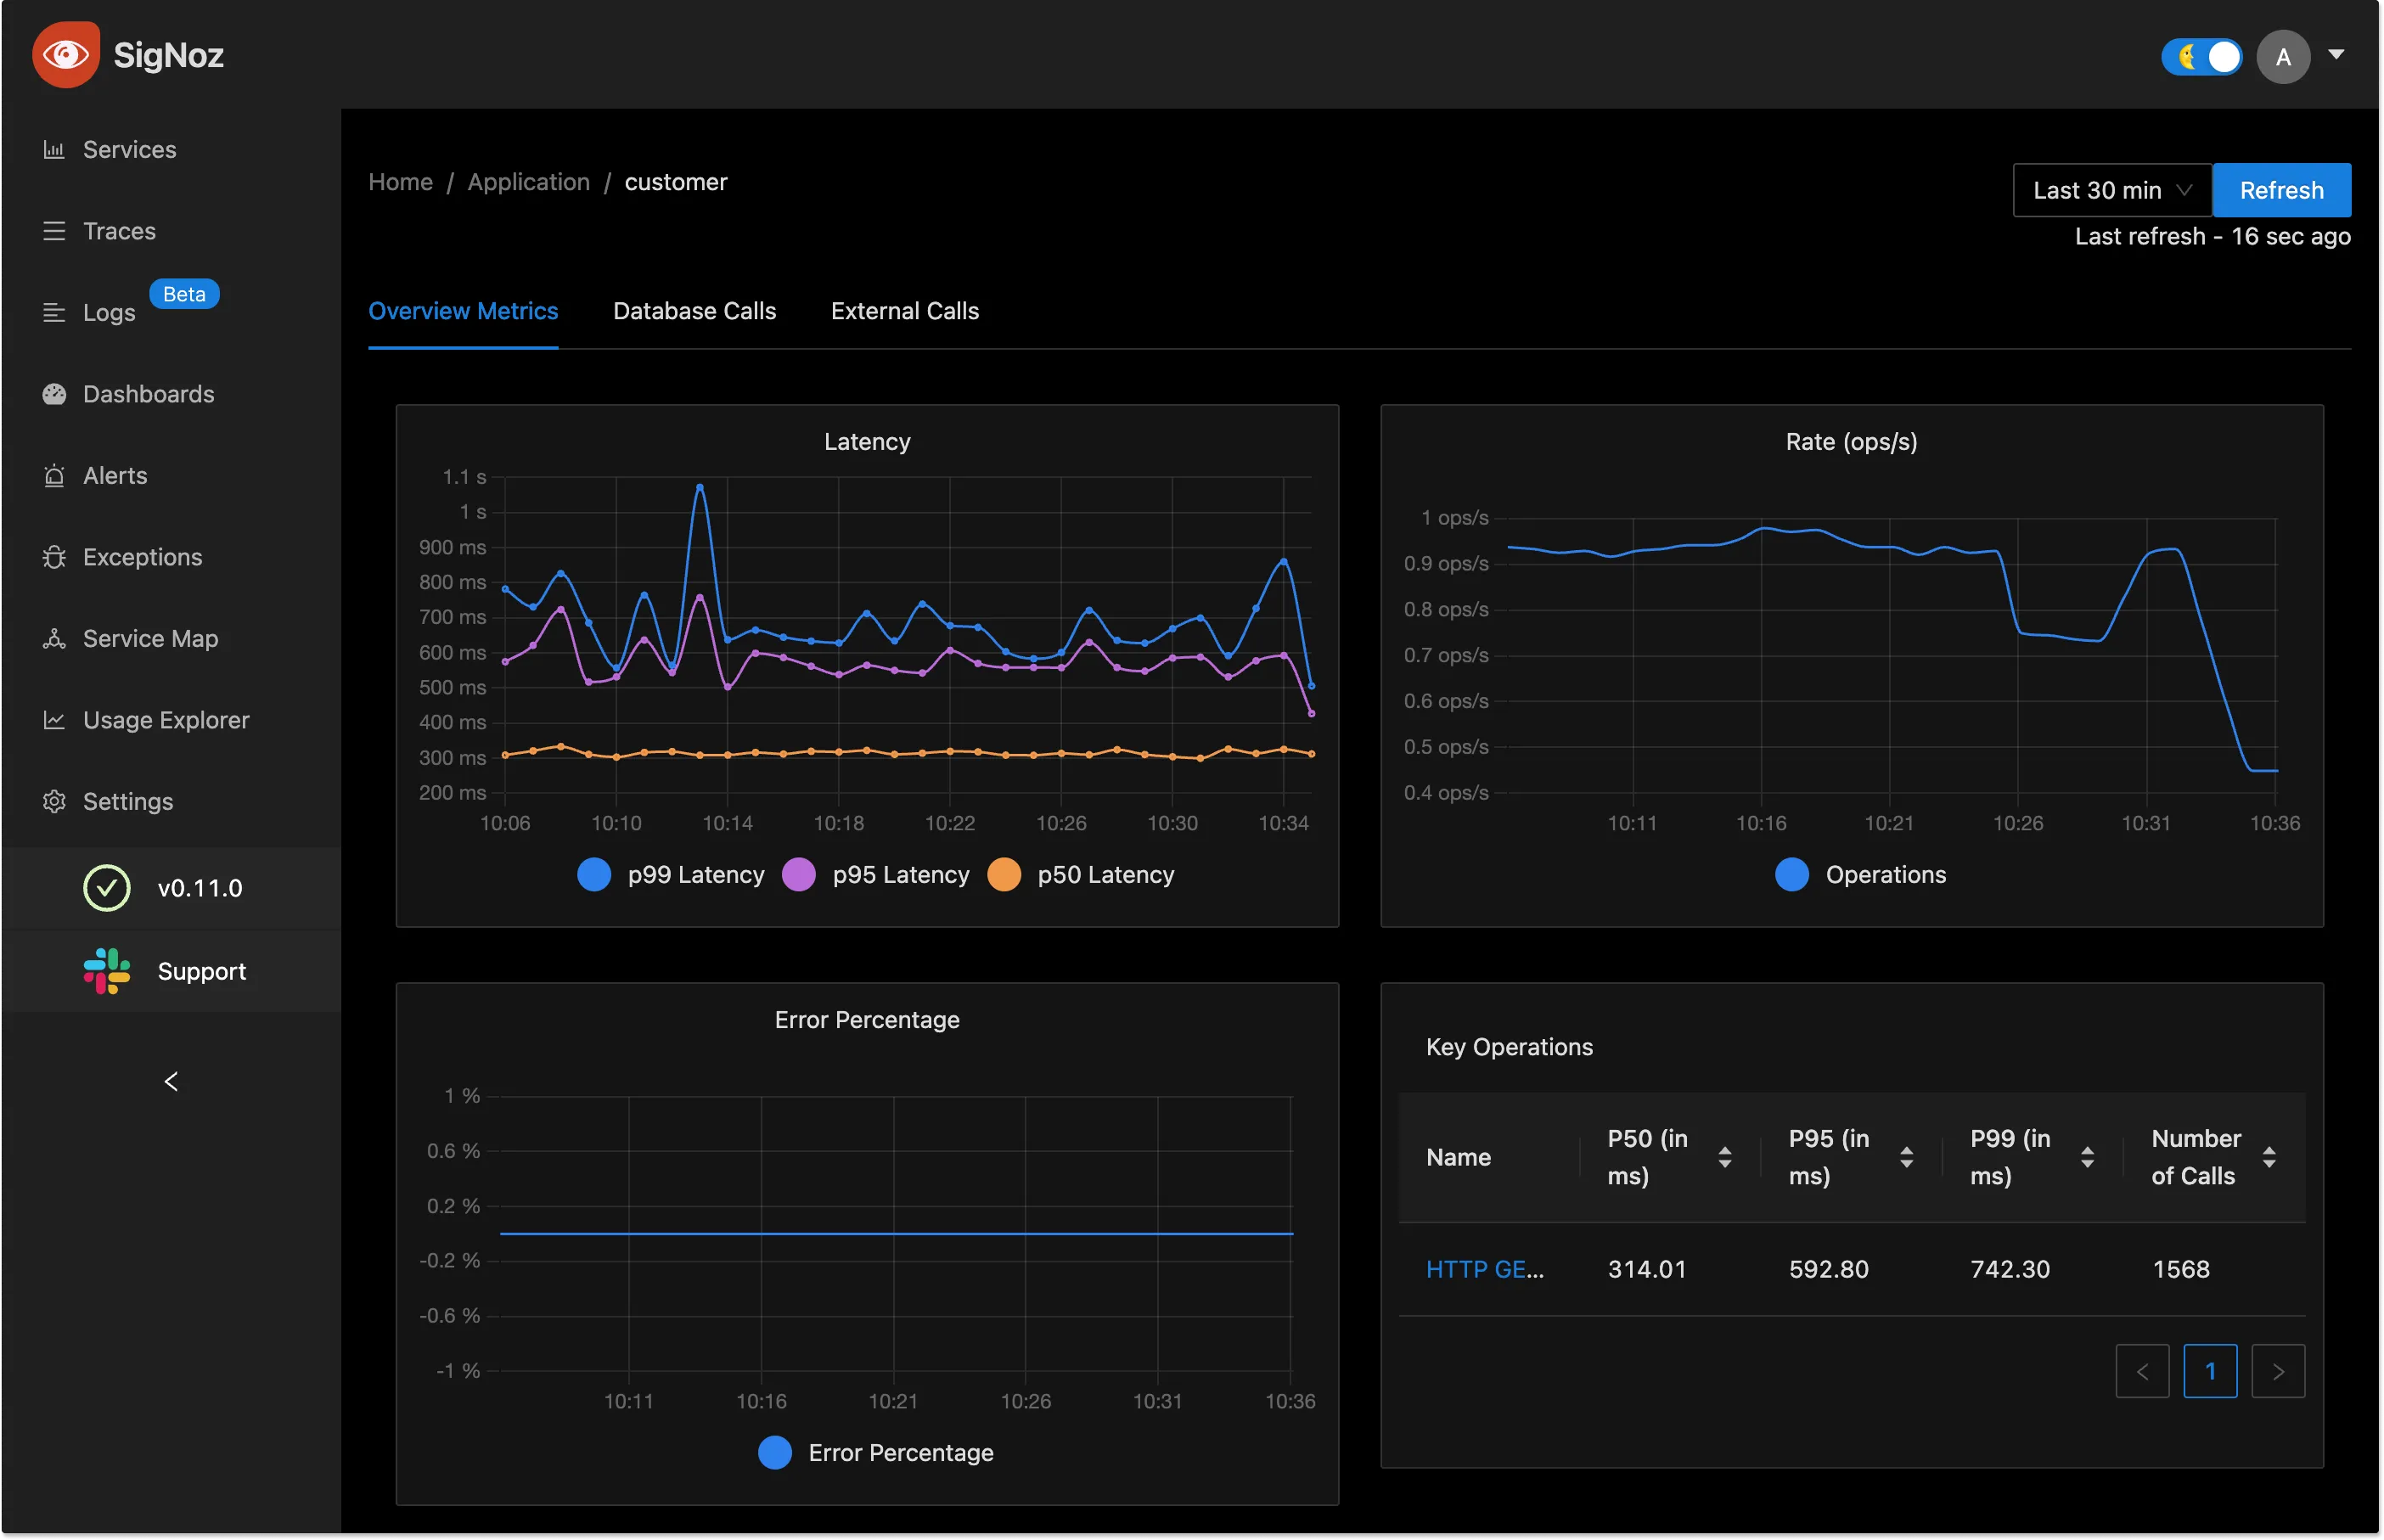
SigNoz is an open source one-stop observability platform built natively on OpenTelemetry. Using SigNoz gives you the flexibility to have a completely open source observability stack. SigNoz comes with out-of-box charts and visualization for application metrics like p99 latency, error rate, and duration.
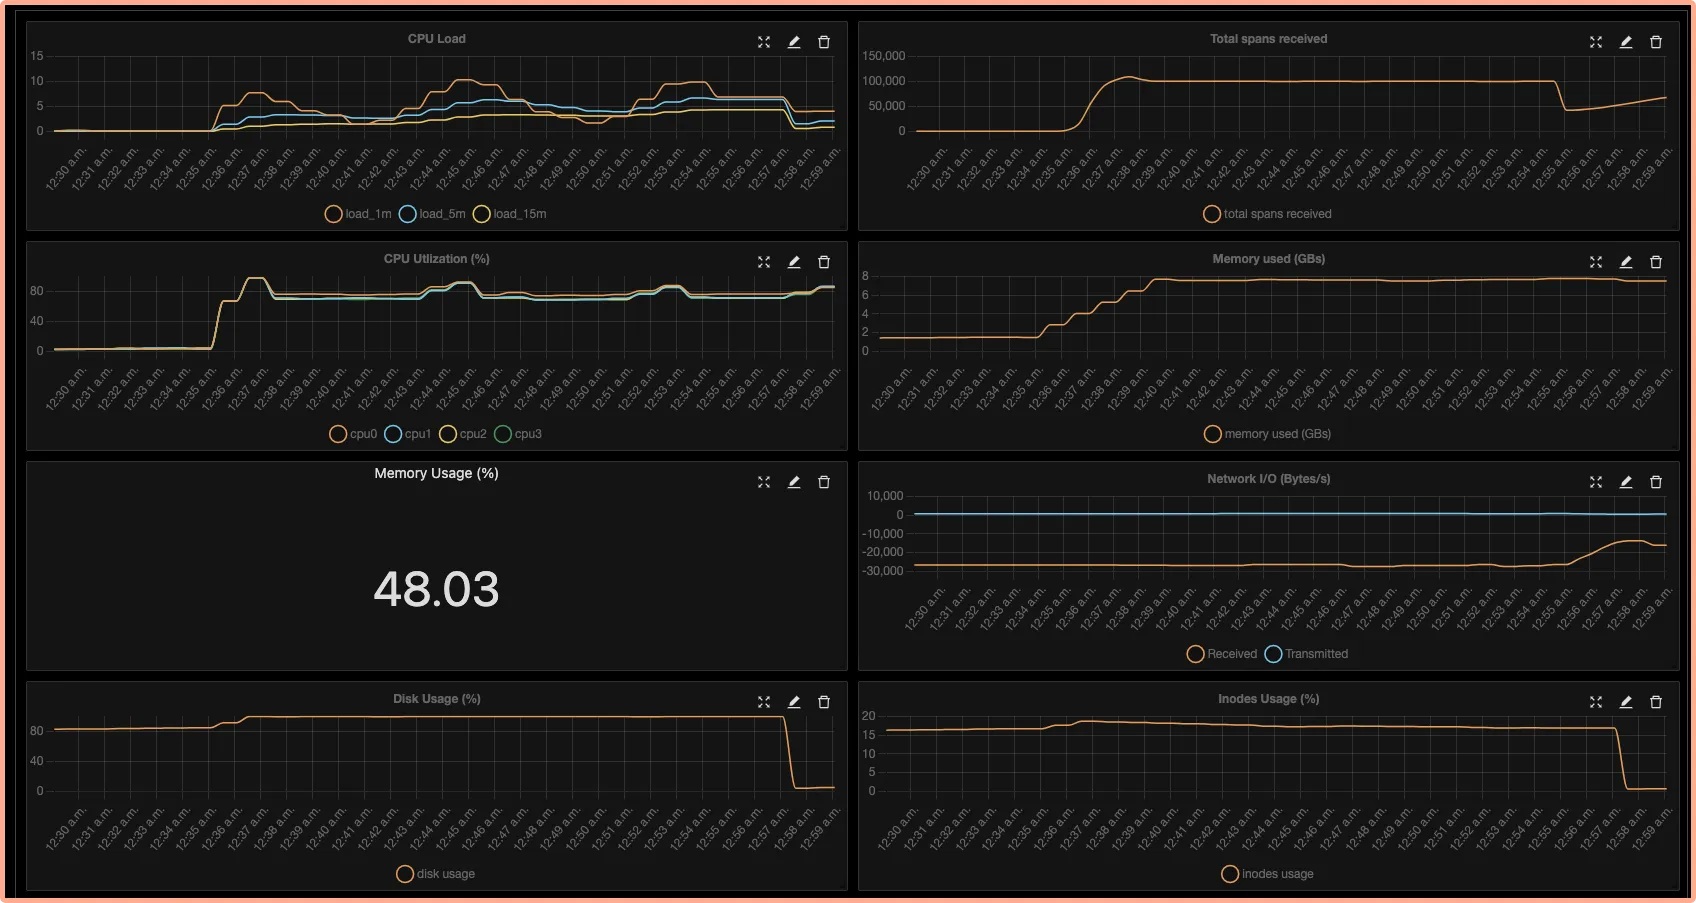
You can also create custom dashboards for monitoring different infrastructure components, host metrics, kubernetes resource metrics, etc.
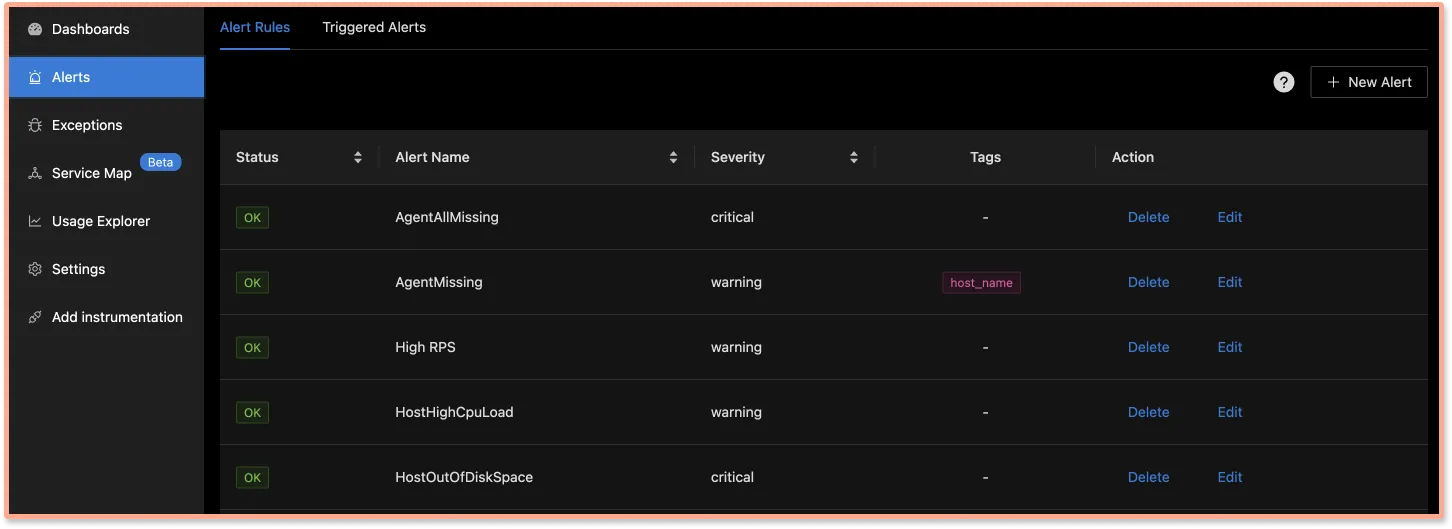
You can also set alerts on metrics that are important for your team and get notified on your preferred communication channels.
You can check out SigNoz by visiting its GitHub repo:

