In this blog, we explain how we enable high availability Prometheus using Cortex and Cassandra. This provides a single pane of view across multiple clusters - which enables visualising all monitoring metrics in one go.

Why need Cortex?
- Long term storage backend for Prometheus - by default Prometheus saves data to local disk and retains for 15 days. Cortex connects to DBs to store data for longer time range. DBs that can be easily integrated are Cassandra, BigTable and DynamoDB
- Enabling HA Prometheus - Usually folks run a singe Prometheus per cluster. If that node is down or Prometheus gets killed, you will find gaps in your graph till the time k8s recreates Prometheus pod. With Cortex, you can run multiple instances of Prometheus in your cluster and Cortex will de-duplicate metrics for you.
- Single pane of view for multi-cluster Prometheus - When you have multiple Prometheuses across multiple clusters, provisioning 1 Grafana dashboard for each cluster will quickly become a pain. Also, aggregating metrics over multiple clusters won't be possible. Cortex enables this by letting Prometheuses in each cluster write their metrics to single DB and provide a label for your cluster. A Grafana dashboard built on top of the shared DB will enable queries to any of the clusters.
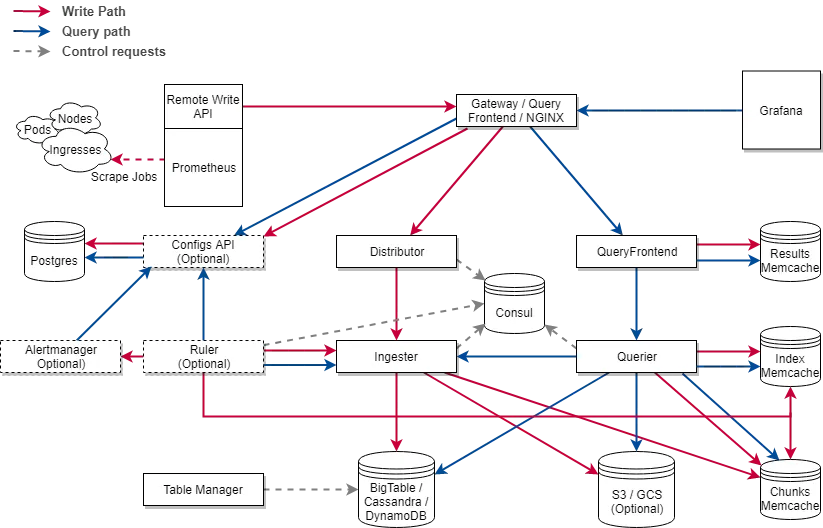
Architecture of Cortex
 Architecture of Cortex
Must know about Ingester
The ingester service is responsible for writing sample data to long-term storage backends (DynamoDB, S3, Cassandra, etc.).
Samples from each timeseries are built up in "chunks" in memory inside each ingester, then flushed to the chunk store. By default each chunk is up to 12 hours long.
If an ingester process crashes or exits abruptly, all the data that has not yet been flushed will be lost. Cortex is usually configured to hold multiple (typically 3) replicas of each timeseries to mitigate this risk.
A hand-over process manages the state when ingesters are added, removed or replaced.
Write de-amplification
Ingesters store the last 12 hours worth of samples in order to perform write de-amplification, i.e. batching and compressing samples for the same series and flushing them out to the chunk store. Under normal operations, there should be many orders of magnitude fewer operations per second (OPS) worth of writes to the chunk store than to the ingesters.
Write de-amplification is the main source of Cortex's low total cost of ownership (TCO).
You can read more about the different components of Cortex here.
Features of Cortex
- Horizontal Scalability**– **Cortex can be split into multiple microservices, each of which can be horizontally scaled independently. For example, if a lot of Prometheus instances are sending data to Cortex, you can scale up the Ingester microservice. If there are a lot of queries to cortex, you can scale up the Querier or Query Frontend microservices.
- High Availability – Cortex can replicate data between instances. This prevents data loss and avoids gaps in metric data even with machine failures and/or pod evictions.
- Multi-Tenancy – Multiple untrusted parties can share the same cluster. Cortex provides isolation of data throughout the entire lifecycle, from ingestion to querying. This is really useful for a large organization storing data for multiple units or applications or for someone running a SaaS service.
- Long term storage – Cortex stores data in chunks and generates an index for them. Cortex can be configured to store this in either self-hosted or cloud provider backed databases or object storage.
Installation
Setup Cassandra in a cluster (3 replicas for the Cassandra):
helm repo add incubator https://kubernetes-charts-incubator.storage.googleapis.com/
helm install --wait --name=cassie incubator/cassandra
Setup Cortex in a cluster:
git clone https://github.com/kanuahs/cortex-demo.git
cd cortex-demo/
kubectl apply -f k8s-cassandra/ - this will deploy various components of Cortex to your cluster.
Ideally, the Cassandra cluster should be separate from Cortex cluster and both of these should be deployed within a separate namespace
Expose NGINX via a LoadBalancer. Our cortex cluster is now ready to collect metrics from Prometheuses.
Check HA Prometheus
Setup another cluster that runs an application (not necessarily) and set up prometheus to send metrics to Cortex you just installed.
helm install stable/prometheus \
--name prom-demo-1-1 \
--set server.global.external_labels.cluster=demo-cluster-1 \
--set server.global.external_labels.replica=one \
--set serverFiles."prometheus\.yml".remote_write[0].url=xx/api/prom/push \
--set serverFiles."prometheus\.yml".remote_write[0].basic_auth.username=xx \
--set serverFiles."prometheus\.yml".remote_write[0].basic_auth.password=xx \
- Cluster label adds cluster as a label to be used for single pane of view in Grafana
- Replica label is used for HA Prometheus setup and de-duplication. Multiple Prometheus setups having the same cluster label but different replica labels will be de-duplicated before ingestion in Cortex.
- Setup
xxin remote_write url to the NGINX IP - Authentication is necessary to identify clients and save Cortex from spurious calls
You can setup another Prometheus in the same cluster using same command and just replacing replica=two. Now you have Prometheus HA setup. Even if one Prometheus goes down, Cortex will use the other Prometheus to get metrics.
We also need to enable ha-tracker mode in distributor of Cortex. Open k8s-cassandra/distributor-dep.yaml in your favorite editor and add the following lines to the args section:
        - -distributor.ha-tracker.enable
        - -distributor.ha-tracker.enable-for-all-users
        - -distributor.ha-tracker.cluster=cluster
        - -distributor.ha-tracker.consul.hostname=consul:8500
        - -distributor.ha-tracker.replica=replica
Authentication using reverse-proxy
We shall use apache2-utils to add authentication to NGINX. I shall demonstrate a POC for authentication. Install the above package by:
apt-get update
apt-get install apache2-utils
You can try the above commands in your local machine.
# create htpasswd_file with user:password
$ htpasswd -cb htpasswd_file user password
Adding password for user user

# add user:password
$ htpasswd -b htpasswd_file user password
Adding password for user user

# verify password for user
$ htpasswd -vb htpasswd_file user wrongpassword
password verification failed

$ htpasswd -vb htpasswd_file user password
Password for user user correct.
Create a file nginx-config-auth.yaml in k8s-cassandra folder. Paste below contents and username: password generated by above command.
apiVersion: v1
kind: ConfigMap
metadata:
  name: basicauth
data:
  htpasswd: |
    ankit:xxxxxxxxxxxxxxxxxxx
Also, change nginx-config.yaml to enable authentication using htpasswd file. Add below line to server block there.
        auth_basic "Restricted Access";
        auth_basic_user_file /etc/serviceproxy/htpasswd;
Now change the k8s-cassandra/nginx-dep.yaml to mount htpasswd file with username and password.
---
apiVersion: extensions/v1beta1
kind: Deployment
metadata:
  name: nginx
spec:
  replicas: 1
  template:
    metadata:
      labels:
        name: nginx
      annotations:
        prometheus.io.scrape: "false"
    spec:
      containers:
      - name: nginx
        image: nginx
        imagePullPolicy: IfNotPresent
        ports:
        - name: http
          containerPort: 80
        volumeMounts:
        - name: config-volume
          mountPath: /etc/nginx
        - name: htpasswd
          mountPath: /etc/serviceproxy/
      volumes:
        - name: config-volume
          configMap:
            name: nginx
        - name: htpasswd
          configMap:
            name: basicauth
            items:
            - key: htpasswd
              path: htpasswd
Scope of improvement -> add config reloader to dynamically add users
Multi-tenancy in Cortex
Cortex identifies tenant by header X-Scope-OrgID. Add the below config in k8s-cassandra/nginx-config.yaml in the server block after auth_basic_user_file command.
proxy_set_header X-Scope-OrgID $remote_user;
This will identify tenants with a username. This is not full-proof.
Ideally you should have a DB and authentication server from where you get the orgId when you pass the username and password of the user
Check single pane of view
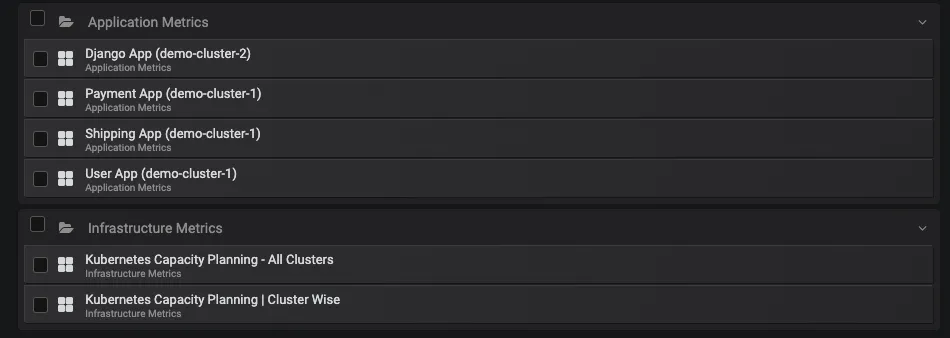
The cluster labels that we specified while helm installing Prometheus will let you run aggregated queries over clusters. The below image shows application metrics from different clusters and Kubernetes Capacity Planning dashboards also cluster-wise.
 Single Pane of view for multi-cluster setup
Provisioning Grafana dashboards for Cortex
We can monitor read and write metrics of Cortex in Grafana. Cortex runs a deployment named retrieval which is a Prometheus server. To enable Prometheus to write into Cortex add authentication details in k8s-cassandra/retrieval-config.yaml.
    remote_write:
      - url: http://nginx.default.svc.cluster.local:80/api/prom/push
        basic_auth:
          username: xxx
          password: xxx
Now install Grafana using command:
helm install stable/grafana --name=grafana-robot \
--set persistence.enabled=true \
--set persistence.type=pvc \
--set datasources."datasources\.yaml".apiVersion=1 \
--set datasources."datasources\.yaml".datasources[0].name=cortex \
--set datasources."datasources\.yaml".datasources[0].type=prometheus \
--set datasources."datasources\.yaml".datasources[0].url=http://nginx.default.svc.cluster.local/api/prom \
--set datasources."datasources\.yaml".datasources[0].access=proxy \
--set datasources."datasources\.yaml".datasources[0].isDefault=true \
--set datasources."datasources\.yaml".datasources[0].basicAuth=true \
--set datasources."datasources\.yaml".datasources[0].basicAuthUser=xxx \
--set datasources."datasources\.yaml".datasources[0].basicAuthPassword=xxx \
--set service.type=LoadBalancer
If you are installing Grafana into a different cluster than the one in which Cortex is running, replace the url with a correct endpoint. The DNS used is for intra-cluster communication.
You can pre-provision dashboards for Cortex performance or you can copy json files to dashboard manually and save them.
Dashboard links and instructions can be found at official Cortex github repo.
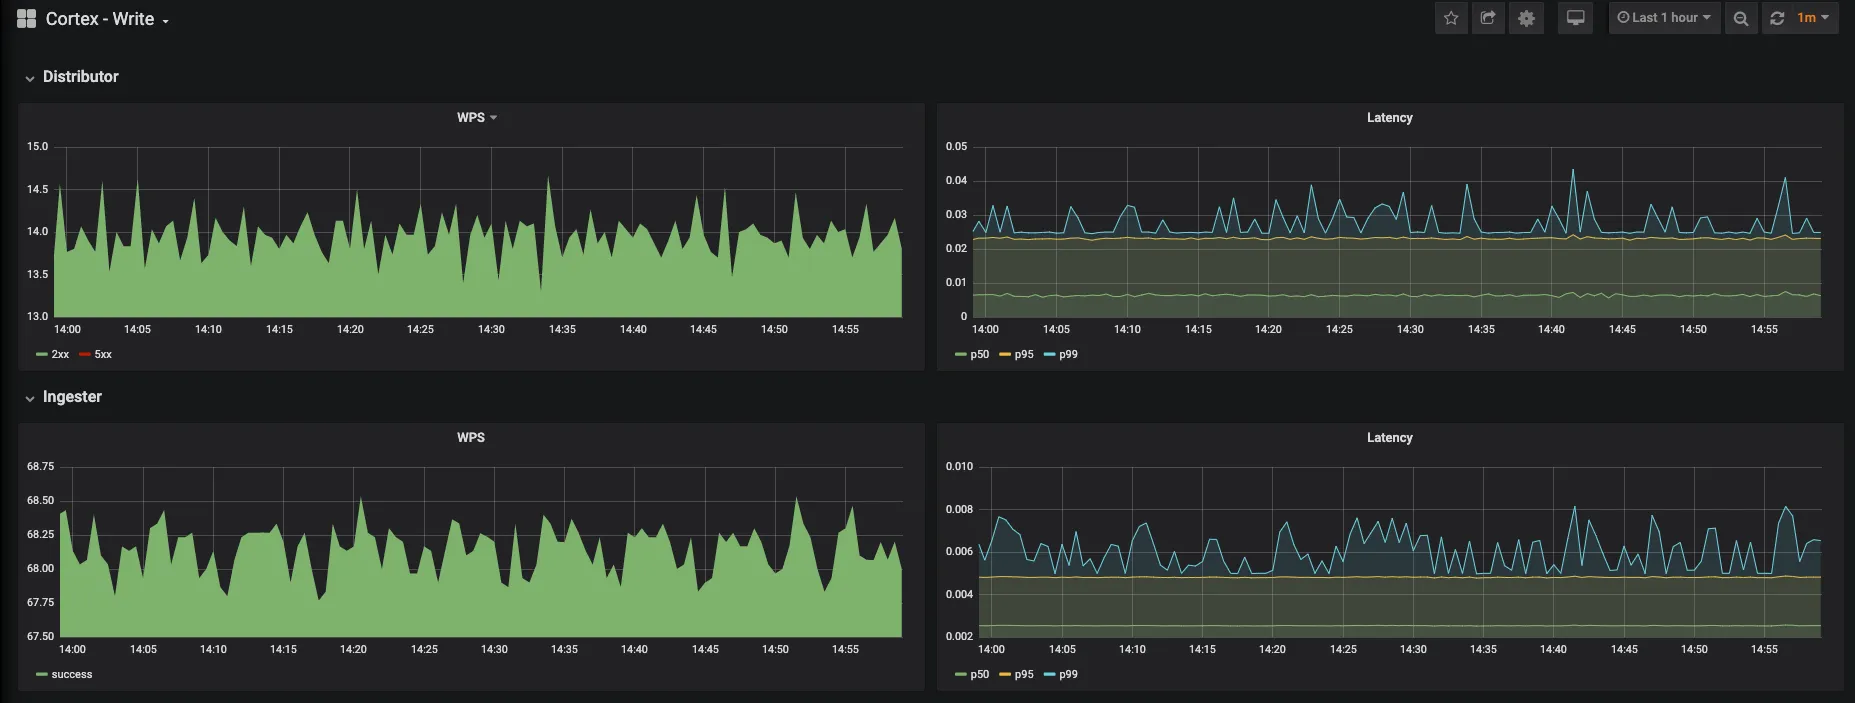
 Cortex Write Dashboard
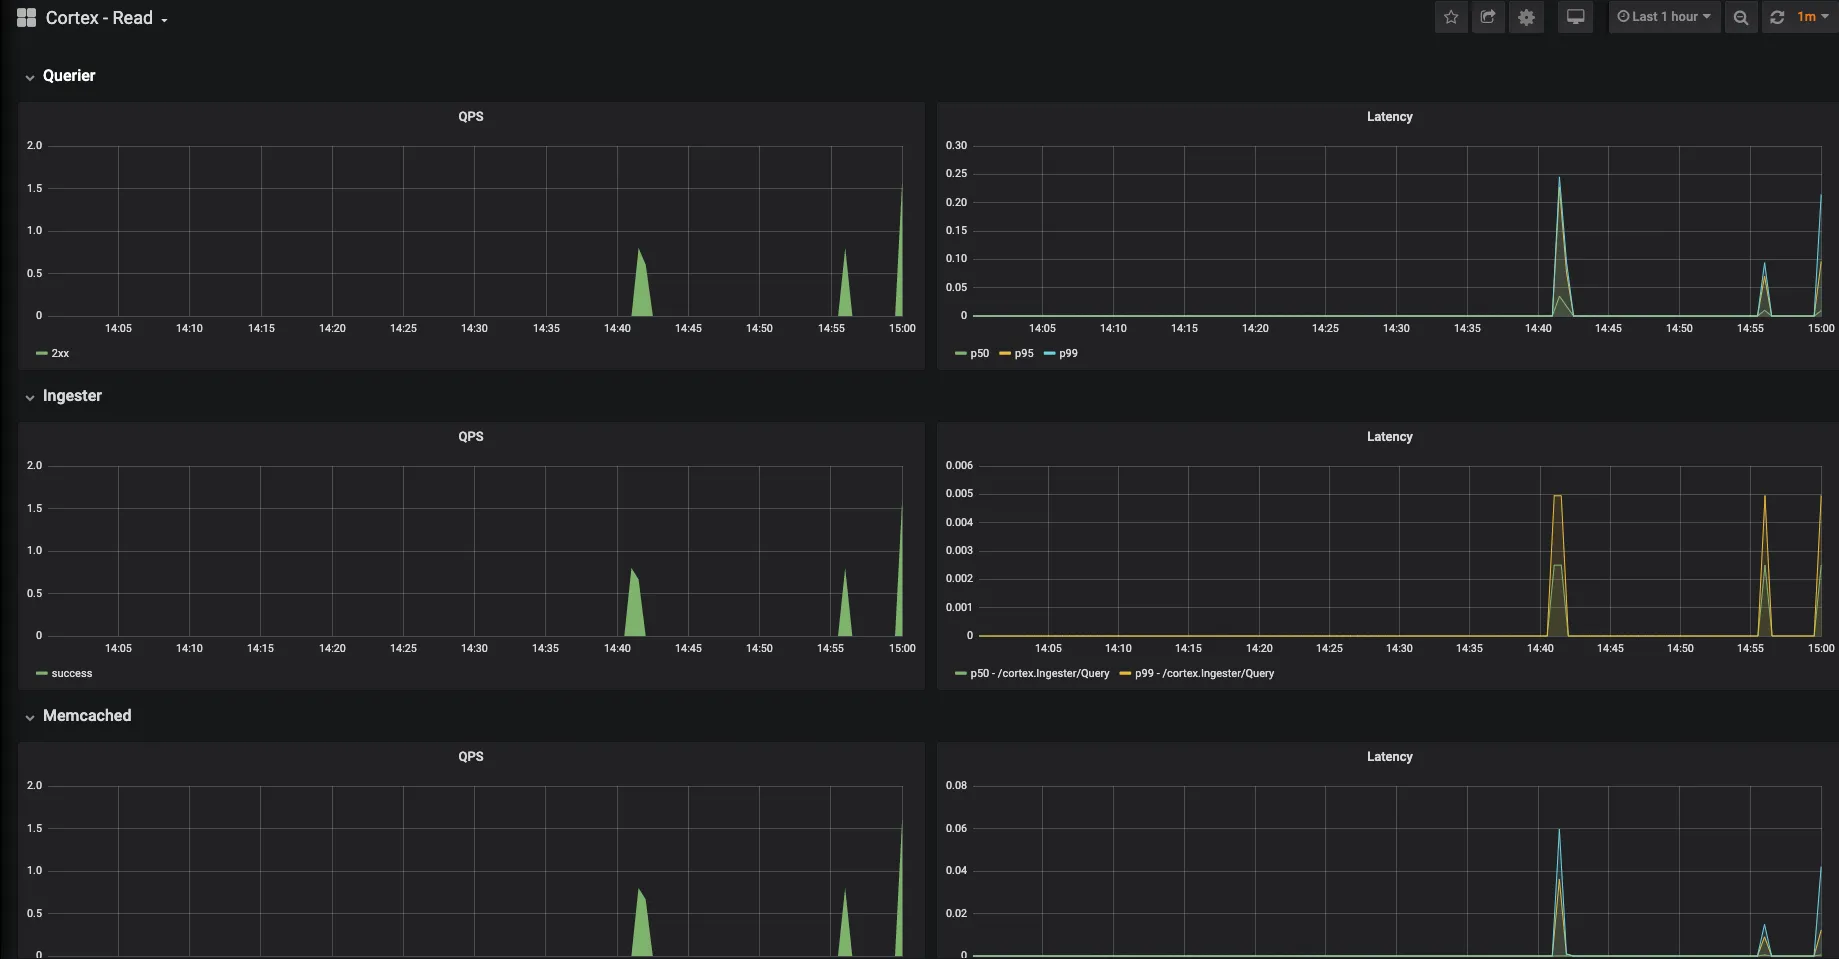
 Cortex Read Dashboard
Using the above dashboards you can monitor Cortex writes/sec by status codes and latencies of Distributor and Ingester. And similarly for reads/sec of Querier, Ingester and Memcache.
Protection against Cardinality Bombing
We can set validation limits in the distributor to check:
- max_label_name_length
- max_label_value_length
- max_label_names_per_series
Further info
Before you make Cortex production-ready, you should go through the below docs to understand the functionality better.

How can I try out remote write in Prometheus?
We provide managed Cortex as a Service. Reach out to us on Signoz Website or DM me to try out the community edition. For any Prometheus related queries, I am reachable at:
On a mission to make monitoring essential and affordable to every business