Spans are fundamental building blocks of distributed tracing. A single trace in distributed tracing consists of a series of tagged time intervals known as spans. Spans represent a logical unit of work in completing a user request or transaction.

Distributed tracing is critical to application performance monitoring in microservice-based architecture. Before we deep dive into spans, let's have a brief overview of distributed tracing.
What is distributed tracing?
In a microservices architecture, a user request travels through hundreds, even thousands of services before serving the user what they need. Engineering teams often responsible for maintaining single services have no visibility over how the system performs as a whole.

Distributed tracing gives insights into how a particular service is performing as part of the whole in a distributed software system. It involves passing a trace context with each user request which is then passed across hosts, services, and protocols to track the user request.
These requests are broken down into spans, and the entire request is represented by a trace.
What are spans in distributed tracing?
In distributed tracing, a user request or a transaction is represented by a trace. Traces are broken down into multiple spans. Spans represent a single logical operation within a trace. For example, a function call during a user request can be represented by a span.
Spans in distributed tracing
What are spans?
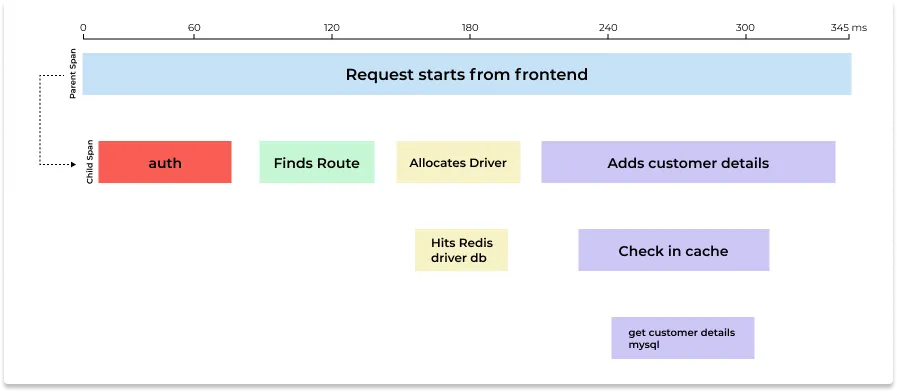
Each unit of work in a trace is represented by a span. A trace represents a complete process for a request - from its initiation to its completion. The picture below shows one trace which is composed of multiple spans.
In the example shown below, the request is initiated from a frontend web client. The first span is the parent span which shows the total time taken by the request.
Parent span calls four services which form the child spans, namely:
- auth - to authenticate the user
- route - to find the nearest route
- driver - to allocate the nearest driver
- customer - to add customer details
These spans can then further have their own child spans.

The first span is known as the parent span and the subsequent spans are child spans.
Parent Span:
Also known as root spans, a parent span encapsulates the end-to-end latency of an entire request. To explain it more clearly, let us define adding a product to a cart on an e-commerce website as a user request. The parent span will measure the time it took from the event of an end-user clicking a button to the product being added to the cart. The parent span can also end if some error occurs.
Child Spans:
A child span is triggered by a parent span and can be a function call, DB calls, calls to another service, etc. In the example mentioned above, a child span can be a function checking whether the item is available or not. Child spans provide visibility into each component of a request.
Combining all the spans in a trace can give you a detailed idea about how the request performed across its entire lifecycle.
What are spans composed of?
A span contains a span context that uniquely identifies the request the span is part of. Spans can provide request, error, and duration metrics that can be used to debug availability and performance issues.
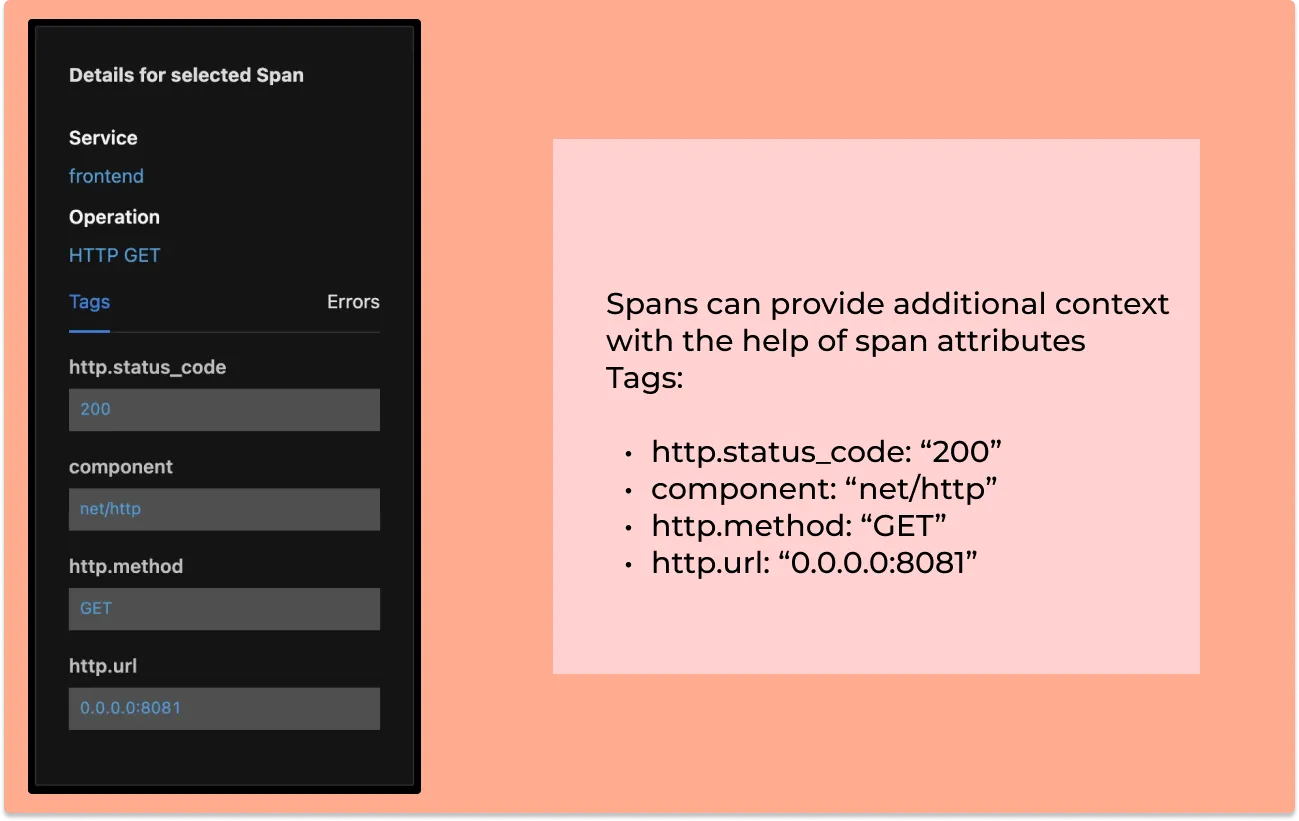
You can also add span attributes to provide more context to your operations. Span attributes are key-value pairs that can be used to provide additional context on a span about the specific operation it tracks.
Let us see details of a selected span in an APM tool like SigNoz.

Example of a basic span
Let’s see an example of creating a basic span using the OpenTelemetry instrumentation library. OpenTelemetry is a set of API, SDKs, libraries, and integrations that is aiming to standardize the generation, collection, and management of telemetry data(logs, metrics, and traces).
Example of creating a basic span in java (Source: OpenTelemetry docs)
Span span = tracer.spanBuilder("my span").startSpan();
// put the span into the current Context
try (Scope scope = span.makeCurrent()) {
    // your use case
    ...
} catch (Throwable t) {
    span.setStatus(StatusCode.ERROR, "Change it to your error message");
} finally {
    span.end(); // closing the scope does not end the span, this has to be done manually
}
Example of adding span attributes
Span span = tracer.spanBuilder("/resource/path").setSpanKind(SpanKind.CLIENT).startSpan();
span.setAttribute("http.method", "GET");
span.setAttribute("http.url", url.toString());
Read more about OpenTelemetry:
OpenTelemetry Collector: architecture and configuration guide
