Curiosity will conquer fear more than bravery will!
- James Stephens
Welcome back to our monthly product updates - SigNal! Our team shipped some major upgrades to SigNoz last month. We’re elated to share that SigNoz is now available with log management. It’s a major milestone in our journey of democratizing observability for developer teams of all sizes.
We also shipped an intuitive alerts builder, attended conferences, and played new games in our Friday chit-chats 🥳 A lot of new open source contributors also helped us in making SigNoz better.
Let’s see what humans at SigNoz were up to in the month of July 2022!
What we shipped?
We have shipped Log Management in a pre-release version for users to try out and provide us feedback. Here’s a link to the pre-release version:
Log Management
Logs, metrics, and traces are often touted as the three pillars of observability. But we believe that at its core, observability is about solving problems fast. And rather than three pillars, we think of logs, metrics, and traces as a single mesh that when correlated intelligently, can help developers solve their application issues quickly.
With logs now available under our hood, developers can use SigNoz as a single-stop observability solution to debug their software systems.
Our log management comes with advanced features like log query builder, search across multiple fields, structured table view, JSON view, etc.
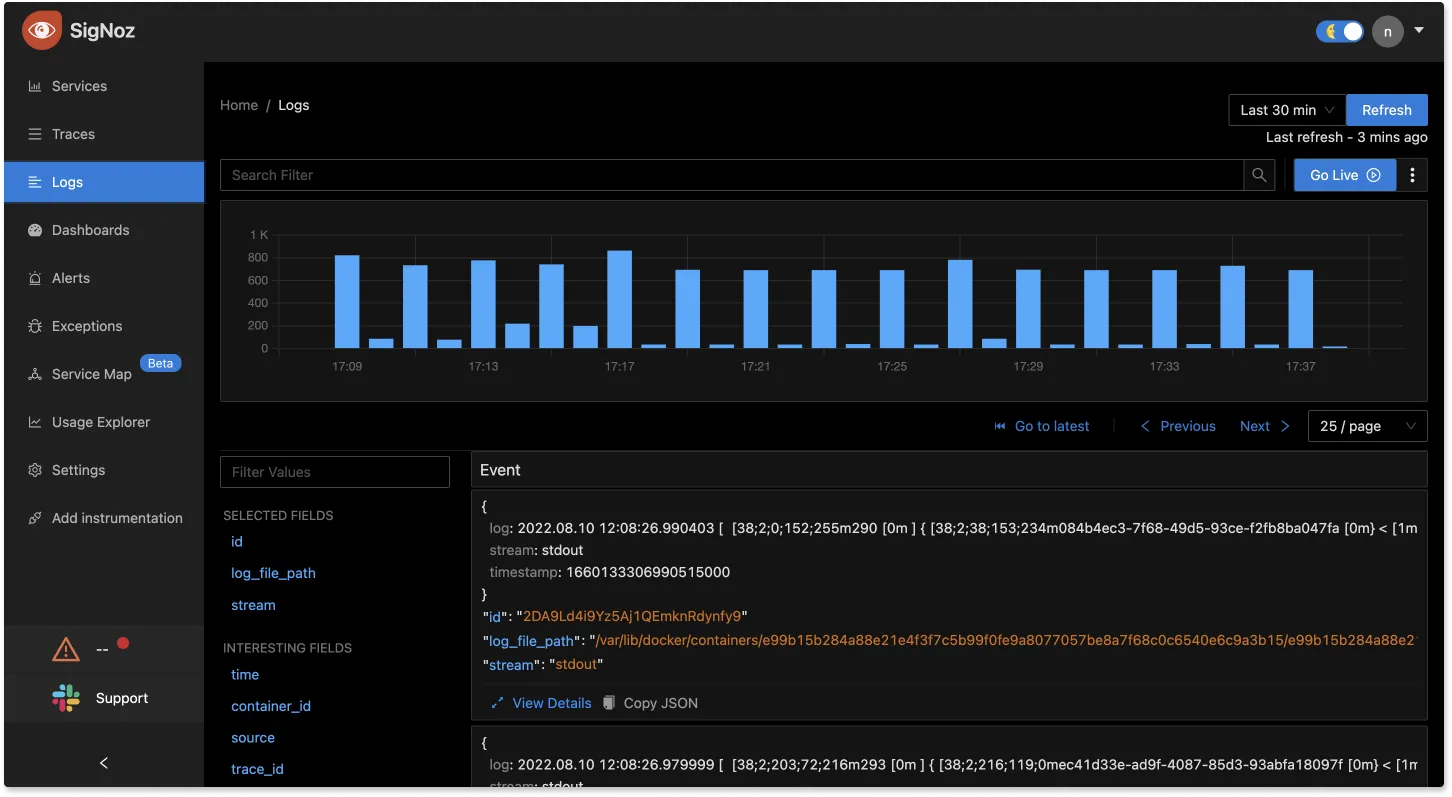
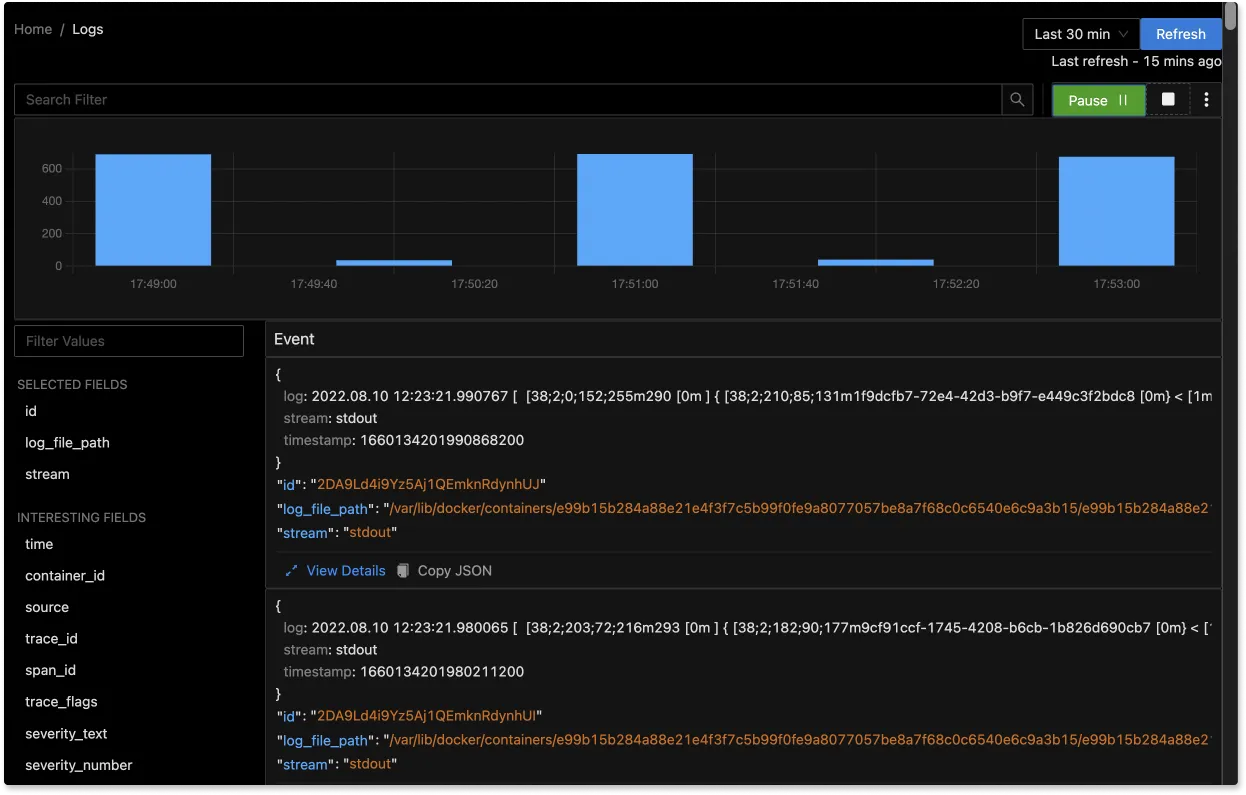
You can also view logs in real time with our live tail logging.
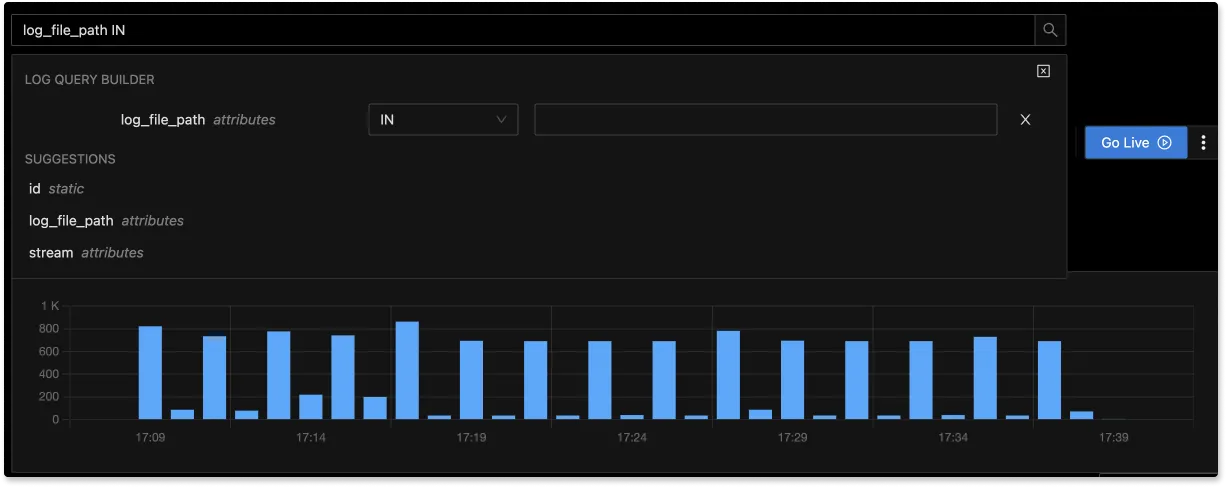
Logs data is often vast, and developers need to check and see the logs they are interested in quickly. With our advanced Log Query Builder, you can filter out logs quickly with a mix and match of fields.
We will come out with detailed guides to demonstrate how to use our log management tab soon. We are also looking to improve our capabilities by working closely with our users. We would love it if you could provide us with some feedback on your experience of using our logs tab.
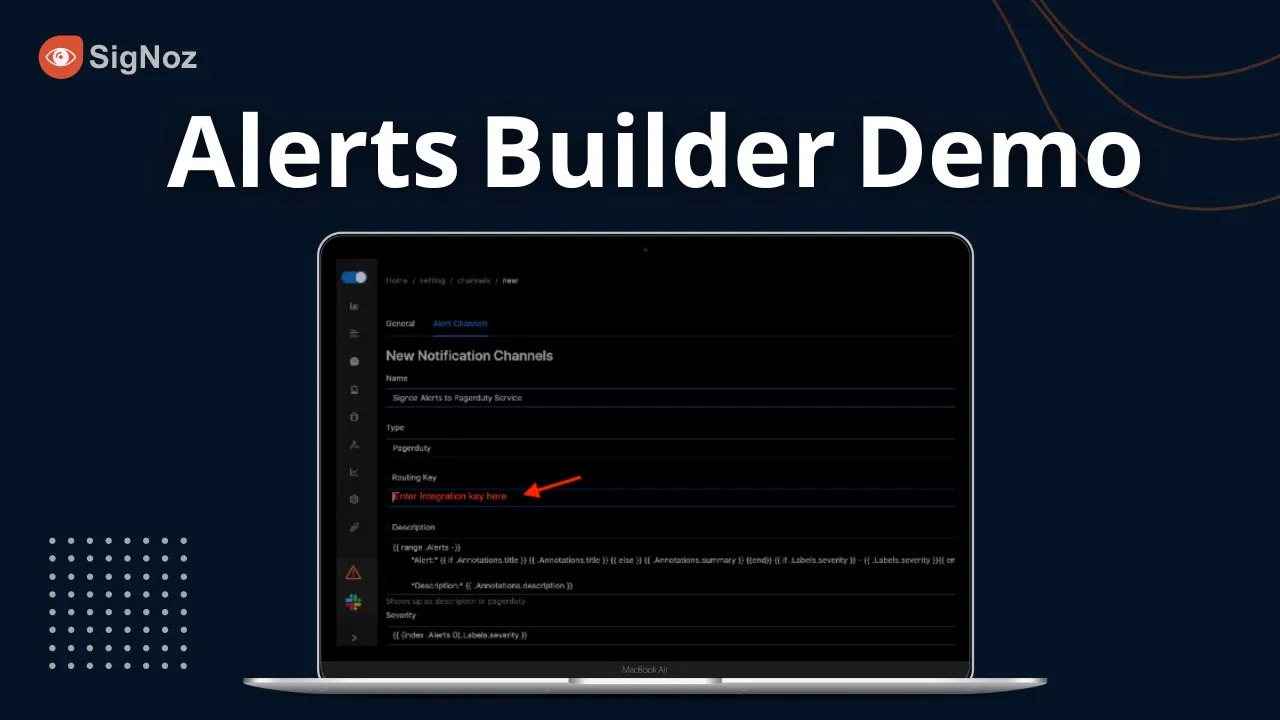
Alerts Builder
We have made it easy for our users to configure alerts on their metrics. With the new alerts builder, users can set alerts quickly without requiring any knowledge of the PromQL query language.

We also did a live demo of the Alerts Builder feature, you can check it out on Youtube👇
Improved Service Map
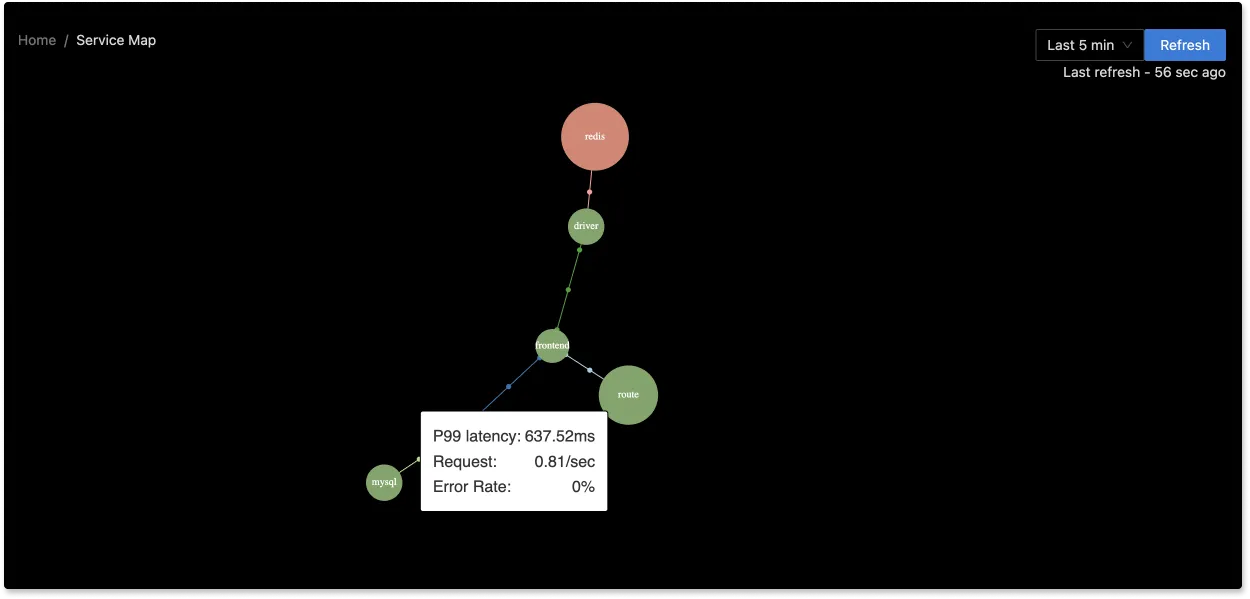
We have improved our service maps to drive insights faster. Based on user feedback, we have updated the maps to show data about transactions between services. For example, if service A is sending requests to service B, you can easily check the p99 latency of those requests.
Other Improvements
We shipped other improvements to our dashboard. You can now see your browser, messaging, or cron services in our Services tab. Earlier, we only used to show services with span kind SERVER, but now you can see all unique services seen by SigNoz.
We also shipped improvements in the Usage Explorer tab and Alerts tab.
What’s upcoming?
Enterprise Features
We have started the research to ship out our first set of enterprise features. SAML and SSO support are the first set of features we are working on. SAML and SSO support are essential for our enterprise users to enable smooth team collaboration while having a secure authentication process in place.
Improvements in Log Management & Alerts Builder
We will work closely with our users to improve log management and alerts builder. Log management is currently v1, so our users can expect more advanced features shipping soon.
Featured Issue
Some of our users are used to seeing service health scores in their observability dashboards. For example, New Relic gives out an APDEX score for the health of monitored services. It can be a good idea to get a quick understanding of how your services are doing at a glance.
If you have any ideas or context about such scores, feel free to share your experience on this GitHub issue.
GitHub Issue for APDEX Score Support
SigNoz News
We participated in FOSS India Conference
Physical meet-ups are back, and our team members are glad to meet people from the community in person! Our team members participated in the FOSS India Conference held in Bengaluru.
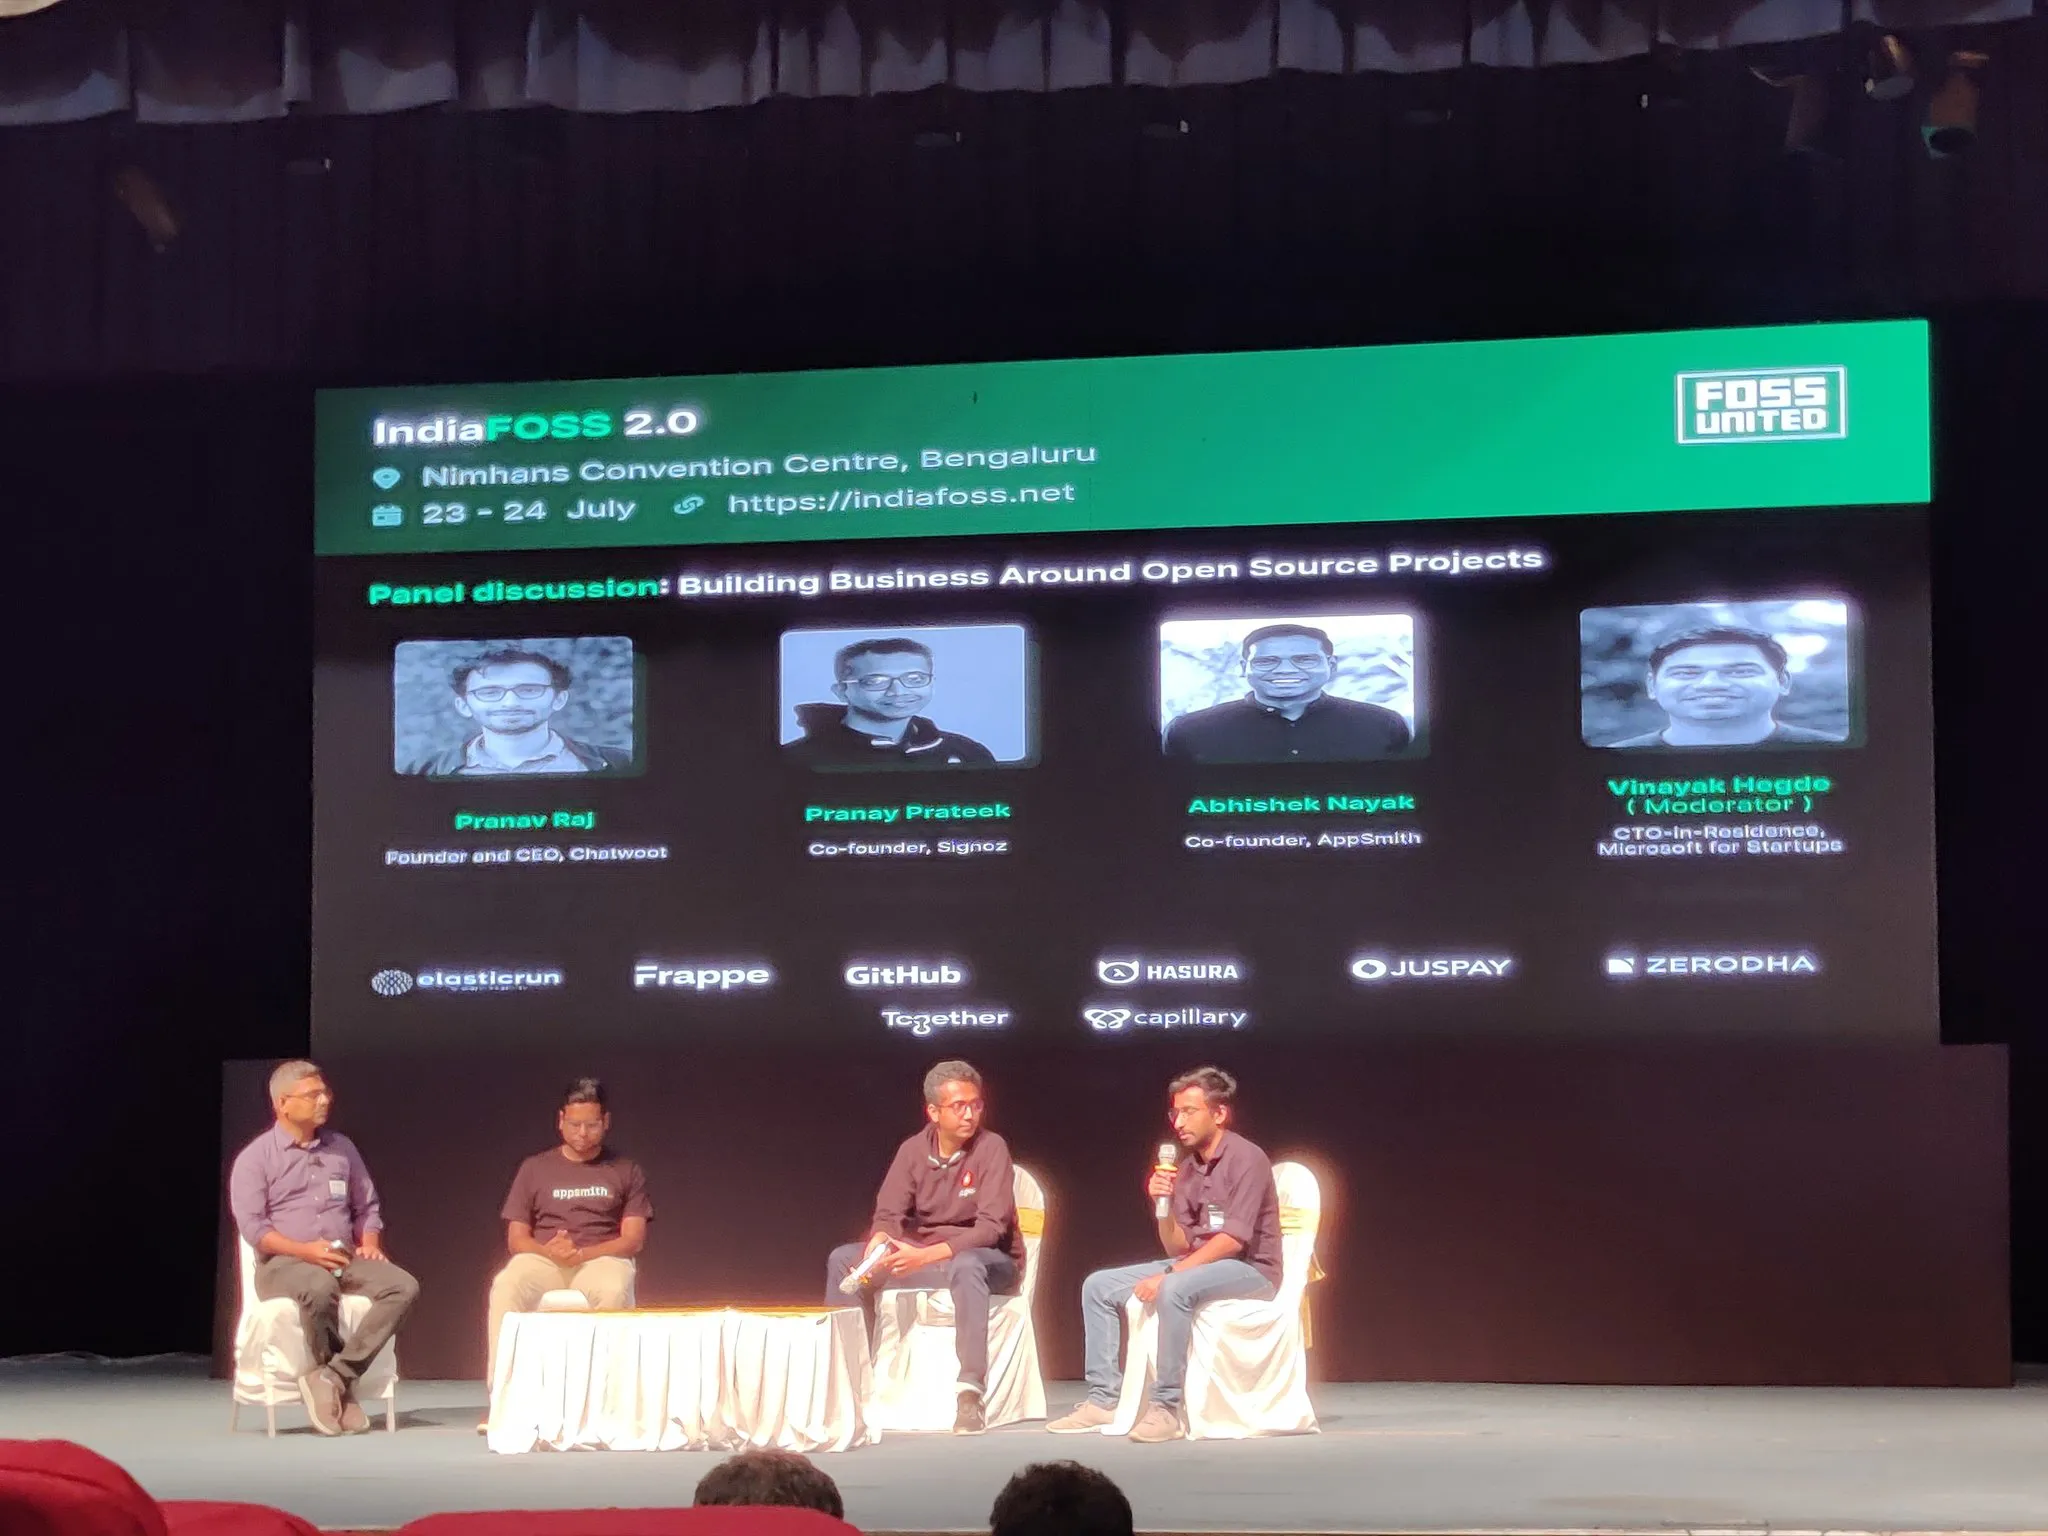
Pranay, our CEO and co-founder, took part in a panel discussion on the topic, “Building business around open source project.”
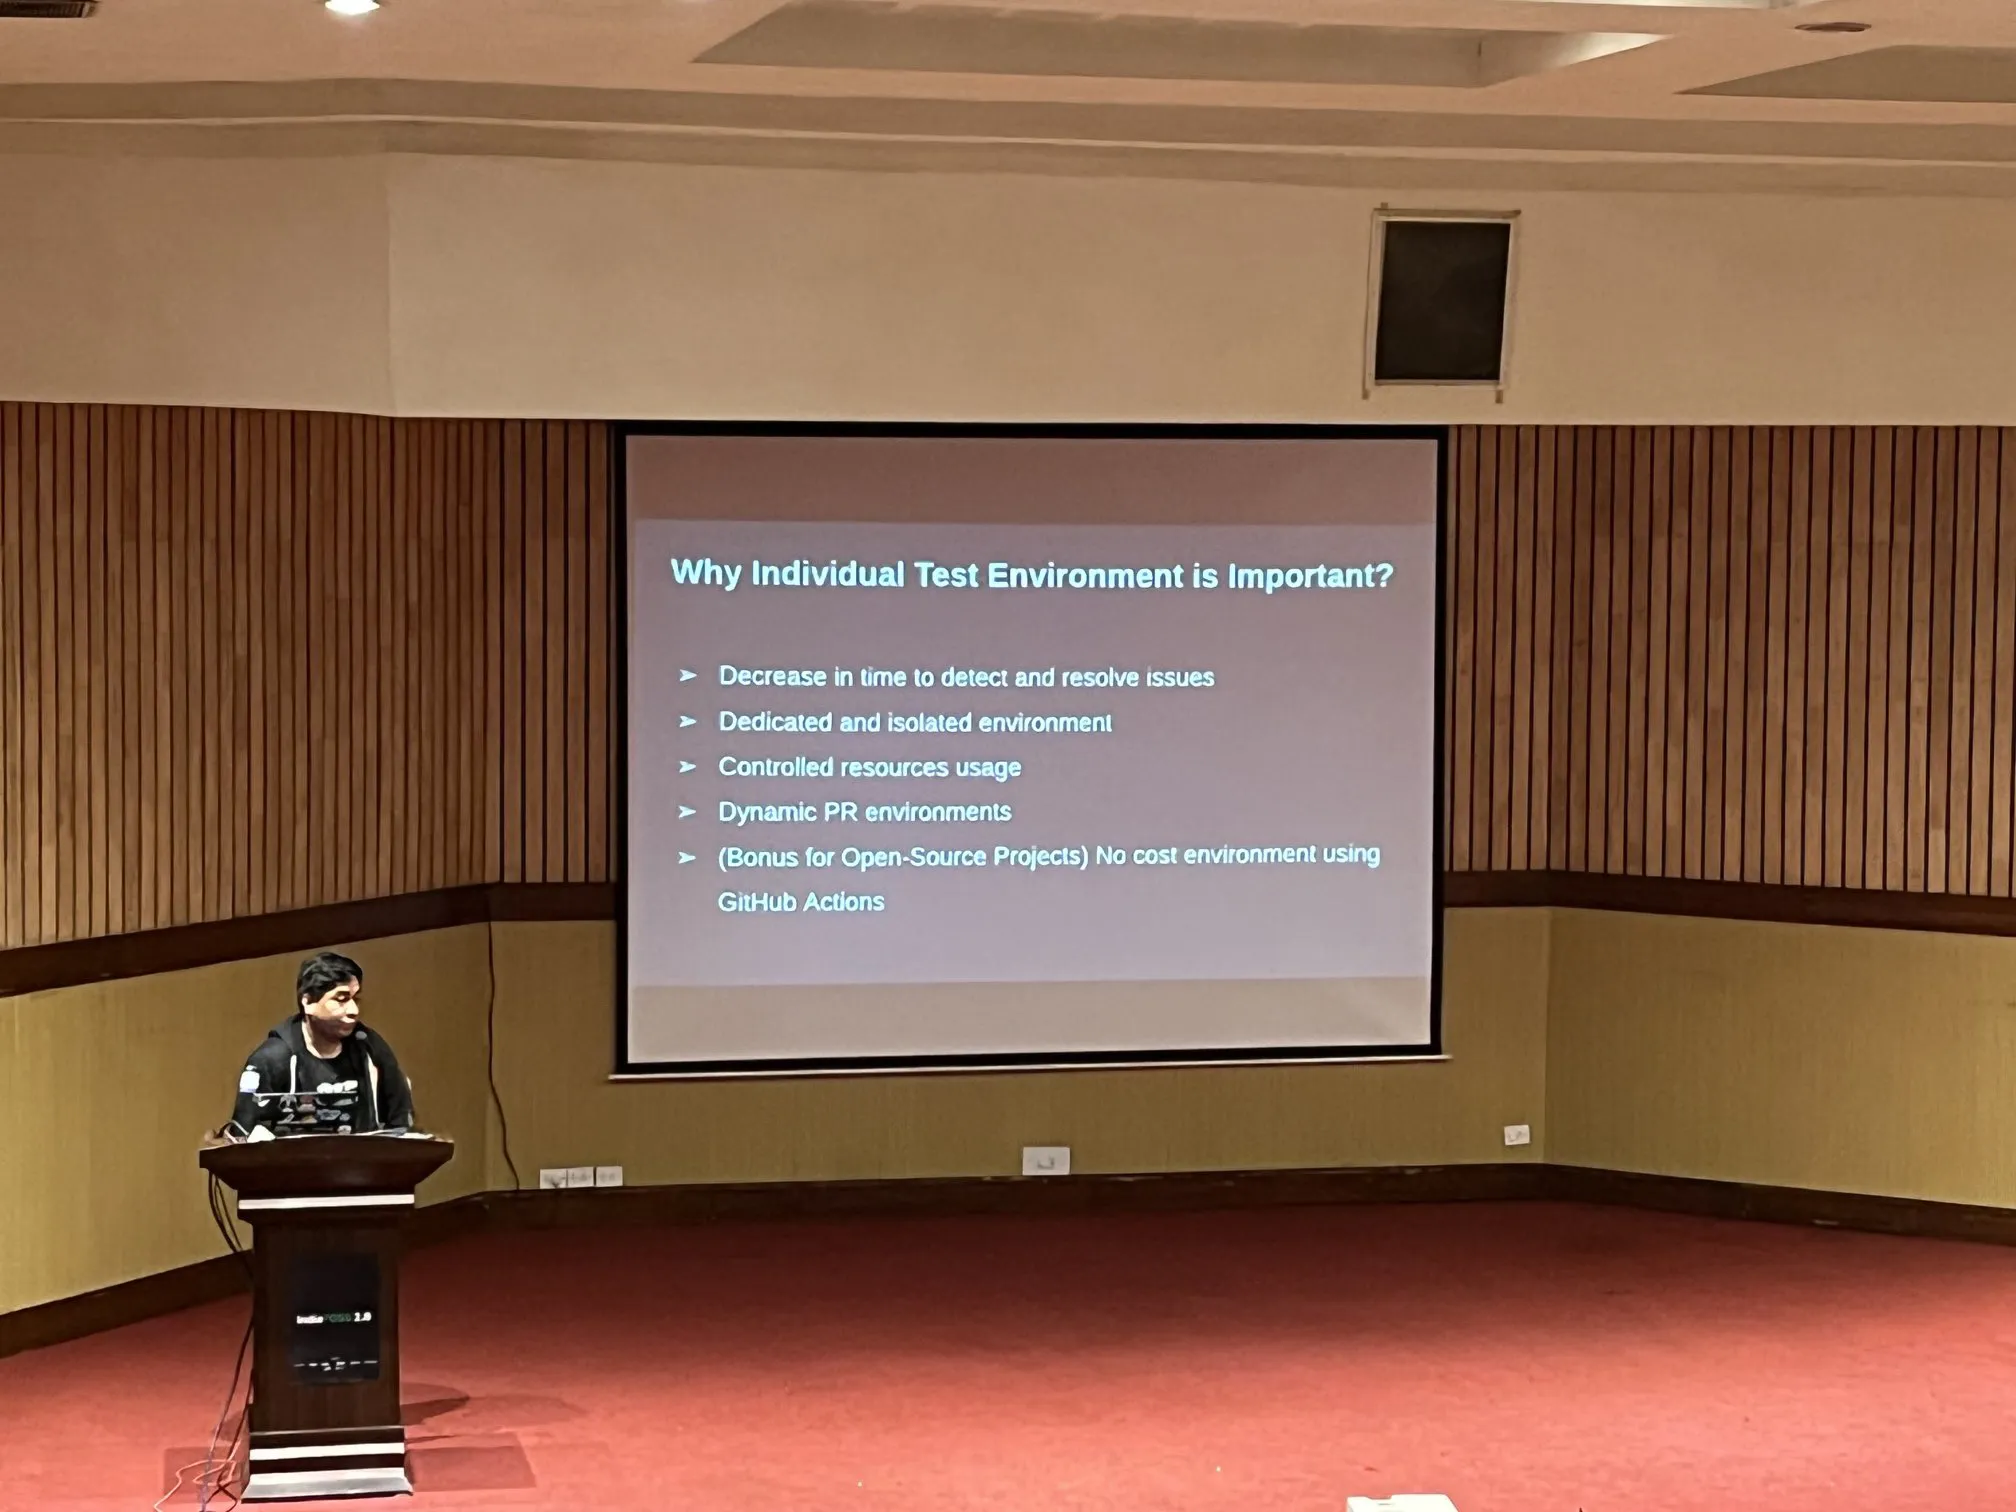
Our DevOps Engineer, Prashant, presented a talk on, “No cost test environments for open source projects.”
Contributor Spotlight
Many new contributors helped us in making SigNoz better last month. We welcome all of you to our contributors tribe. Thanks a ton for helping us in our mission of open source observability🤗
From our Blog
Monitoring Redis for performance issues is critical. Redis is famous for its low-latency response while serving a large number of queries. There are certain key metrics that you can monitor to keep track of your Redis instance performance.
You can collect Redis monitoring metrics with OpenTelemetry and create monitoring dashboards with SigNoz. Read this guide to learn how to monitor Redis with SigNoz and OpenTelemetry.
Redis Monitoring with OpenTelemetry and SigNoz
Thank you for taking out the time to read this issue :) If you have any feedback or want any changes to the format, please create an issue.
Feel free to join our slack community and say hi! 👋

